Hurricane Laura Cat 4, Limited Damage Follows
- Oil prices remain muted as Laura howls
- Proactive close of Gulf Coast facilities eases supply concerns
- Rebounding demand supports prices
- Natural gas futures break resistance

The Matrix
A week that saw two tropical storms turn into hurricanes—and one of them a cat 4 monster—and clear evidence that the outlook for petroleum demand was bullish were not enough to break the tight range that has accompanied oil pricing over the past two months.
Crude oil futures have been essentially flat. Since the end of June, WTI crude oil spot futures have moved slowly higher, adding $5.35 to value. (Brent, the international crude oil price marker, did not range more than one dollar in either direction for seven consecutive weeks.)
A proactive response to the dangers of Hurricane Laura explains in part why the market response was so muted. Press reports estimated that more than four-fifths of Gulf of Mexico crude oil production was shut. Onshore, terminals and refineries closed in expectation of punishing winds and water. Ironically, lower demand because of COVID-19 helped ease the supply situation. A full capacity petroleum industry running at peak demand could have made supply more challenging.
If these supply shortfalls were not enough to support price, demand in the United States is rebounding. Product demand fell to 13.8 million barrels daily in April when the economy closed. Most recently, total product demand has clocked in at 19.6 million barrels per day, an improvement of 42%. Oil demand still lags last year at this time by nearly 12% but is clearly moving back towards parity.
One analysis expects demand to recover lost ground by 2022. This analysis points to a return of commuter traffic, returning reliance on private spending on transportation and richer infrastructure budgets.
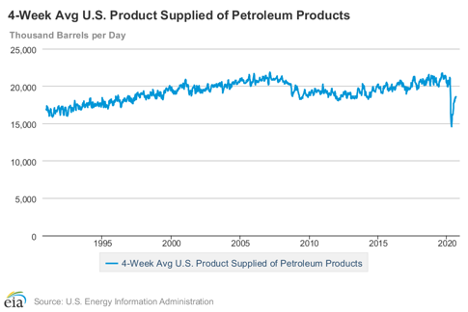
Petroleum Products Supplied, 1990 – 2020 Source: EIA
There are also bearish factors holding oil prices in tension. Shale oil production showed its first increase in the EIA’s petroleum balance sheet since January, when output topped out at 13 million barrels per day. The industry lost more than two million barrels of crude oil production in that time.
Supply/Demand Balances
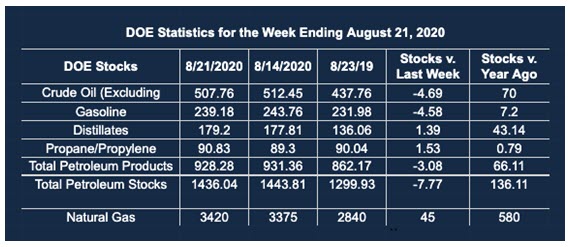
Supply/demand data in the United States for the week ended Aug. 21, 2020, were released by the Energy Information Administration.
Total commercial stocks of petroleum fell by 7.8 million barrels during the week ended Aug. 21, 2020.
Commercial crude oil supplies in the United States decreased by 4.7 million barrels from the previous report week to 507.8 million barrels.
Crude oil inventory changes by PAD District:
PADD 1: Minus 0.3 million barrels to 11.5 million barrels
PADD 2: Minus 0.5 million barrels to 141.3 million barrels
PADD 3: Minus 2.5 million barrels to 276.7 million barrels
PADD 4: Unchanged at 25.3 million barrels
PADD 5: Minus 1.5 million barrels to 52.9 million barrels
Cushing, Oklahoma inventories were up 0.3 million barrels from the previous report week to 52.43 million barrels.
Domestic crude oil production rose 100,000 barrels per day from the previous report week to 10.8 million barrels daily.
Crude oil imports averaged 5.916 million barrels per day, a daily increase of 185,000 barrels. Exports increased 1.226 barrels daily to 3.363 million barrels per day.
Refineries used 82.0% of capacity, up 1.1% from the previous report week.
Crude oil inputs to refineries increased 225,000 barrels daily; there were 14.712 million barrels per day of crude oil run to facilities. Gross inputs, which include blending stocks, rose 208,000 barrels daily to reach 15.290 million barrels daily.
Total petroleum product inventories fell 3.1 million barrels from the previous report week.
Gasoline stocks decreased 4.6 million barrels daily from the previous report week; total stocks are 239.2 million barrels.
Demand for gasoline rose 531,000 barrels per day to 9.161 million barrels per day.
Total product demand increased 2.460 million barrels daily to 19.619 million barrels per day.
Distillate fuel oil stocks increased 1.4 million barrels from the previous report week; distillate stocks are at 179.2 million barrels. EIA reported national distillate demand at 3.958 million barrels per day during the report week, an increase of 705,000 barrels daily.
Propane stocks increased 1.5 million barrels from the previous report week; propane stocks are 90.8 million barrels. The report estimated current demand at 1.215 million barrels per day, an increase of 108,000 barrels daily from the previous report week.
Natural Gas
Powerhouse’s Weekly Energy Market Situation for August 3 noted “the fact that August is typically when natural prices tend to bottom seasonally. This may be the most important reason natural gas performed so strongly as August trading opened.”
This proved to be a solid observation. The low for spot natural gas futures as the month opened was $1.92. Expiration of the September natural gas futures came at $2.58, a monthly gain of 34 percent.
The gain came with a massive Category 4 Hurricane, Laura, which seemed to have little effect on pricing. Factors like loss of power load, shut-in of production and potential loss of LNG played into market action, balancing the actions of bulls and bears.
September futures prices settled above resistance at $2.58. This opens the way to new resistance at $2.70 and then $2.905.
According to the EIA:
The net injections into [natural gas] storage totaled 45 Bcf for the week ending August 21, compared with the five-year (2015–19) average net injections of 49 Bcf and last year’s net injections of 60 Bcf during the same week. Working natural gas stocks totaled 3,420 Bcf, which is 438 Bcf more than the five-year average and 580 Bcf more than last year at this time.
The average rate of injections into storage is 10% higher than the five-year average so far in the refill season (April through October). If the rate of injections into storage matched the five-year average of 10.4 Bcf/d for the remainder of the refill season, the total inventory would be 4,161 Bcf on October 31, which is 438 Bcf higher than the five-year average of 3,723 Bcf for that time of year.
Was this helpful? We’d like your feedback.
Please respond to [email protected]
Powerhouse Futures & Trading Disclaimer
Copyright 2020 Powerhouse Brokerage, LLC, All rights reserved