Divergence Within Seasonal Trends
- Not all energy commodities tracking expectations
- Economic & weather factors may explain difference
- Gasoline rally weakening
- Excess supply of natural gas remains
Sincerely,
David Thompson & Alan Levine
Powerhouse
(202) 333-5380
The Matrix
Powerhouse has written extensively about the strong seasonal tendencies in petroleum prices. Perhaps the most analyzed is the tendency for petroleum prices (crude, gasoline and diesel) to rally during the period between the latter part of Q4 into Q2 of the following year. This tendency is playing out this year with one noticeable exception.
Diesel, RBOB, WTI (and Brent) futures all made significant seasonal lows in the second week of December 2023. Since the daily closing prices on December 12, 2023, until today’s close, the front-month RBOB contract gained 39.14%. The front-month WTI crude contract rallied 24.22%. Front-month ULSD futures contract has advanced only 6.71%.
The demand curves tell the tale. While wholesale demand for gasoline (as reported by the EIA on a year-over-year basis) is lagging last year’s level by 0.5%, distillate demand is off by 6.3%. EIA also computes a statistic called the cumulative daily average. This is a running total of the average, daily, cumulative demand for 2024 versus 2023. By this count, diesel is again lagging, this time by 3.1%, whereas gasoline cumulative demand is only off by 0.6%.
What’s driving this noticeable disparity? U.S. employment and wage statistics show workers finding jobs and at wage rates now ahead of inflation. This combination is supportive for U.S. gasoline demand. In contrast, mild winters in both the U.S. and Europe have mitigated fears of a spike in weather-driven demand for heating fuels. Additionally, Chinese demand for diesel has been unseasonably weak. General economic conditions certainly play a part in this but interestingly, China’s push to decarbonize has led liquefied natural gas to displace diesel demand in the trucking sector.
The typical Q4 – Q2 rally in petroleum prices is now entering its 6th or 7th inning. If ULSD futures prices want to join the rally, a move above resistance at $2.80 is necessary. Support currently can be found near the $2.60 level. RBOB futures remain in bullish mode although some trend-following indicators are starting to show signs of fatigue. Current support for front-month RBOB futures is at $2.63.
Supply/Demand Balances
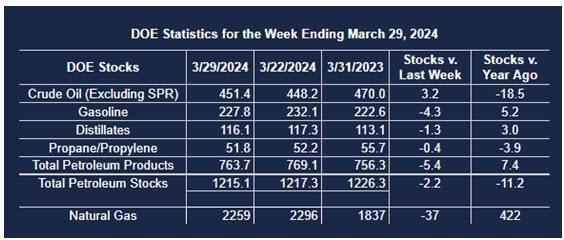
Supply/demand data in the United States for the week ended March 29, 2024, were released by the Energy Information Administration.
Total commercial stocks of petroleum fell (⬇) 2.2 million barrels to 1.2151 billion barrels during the week ended March 29, 2024.
Commercial crude oil supplies in the United States were higher (⬆) by 3.2 million barrels from the previous report week to 451.4 million barrels.
Crude oil inventory changes by PAD District:
PADD 1: Down (⬇) 1.4 million barrels at 7.4 million barrels
PADD 2: Up (⬆) 0.3 million barrels to 119.5 million barrels
PADD 3: Up (⬆) 2.1 million barrels to 250.4 million barrels
PADD 4: Down (⬇) 0.2 million barrels at 26.0 million barrels
PADD 5: Up (⬆) 2.5 million barrels to 48.2 million barrels
Cushing, Oklahoma, inventories were down (⬇) 0.3 million barrels from the previous report week to 33.2 million barrels.
Domestic crude oil production was unchanged (=) at 13.1 million barrels daily.
Crude oil imports averaged 6.702 million barrels per day, a daily increase (⬆) of 424,000 barrels. Exports decreased (⬇) 700,000 barrels daily to 4.181 million barrels per day.
Refineries used 88.6% of capacity; 0.1 percentage points lower (⬇) than the previous report week.
Crude oil inputs to refineries decreased (⬇) 35,000 barrels daily; there were 15.897 million barrels per day of crude oil run to facilities. Gross inputs, which include blending stocks, decreased (⬇) 43,000 barrels daily to 16.249 million barrels daily.
Total petroleum product inventories decreased (⬇) by 5.4 million barrels from the previous report week, up to 763.7 million barrels.
Total product demand increased (⬆) 1,762,000 barrels daily to 21.292 million barrels per day.
Gasoline stocks decreased (⬇) 4.3 million barrels from the previous report week; total stocks are 227.8 million barrels.
Demand for gasoline decreased (⬆) 521,000 barrels per day to 9.236 million barrels per day.
Distillate fuel oil stocks decreased (⬇) 1.3 million barrels from the previous report week; distillate stocks are at 116.1 million barrels. EIA reported national distillate demand at 3.495 million barrels per day during the report week, a decrease (⬇) of 553,000 barrels daily.
Propane stocks fell 0.4 million barrels (⬇) from the previous report to 51.8 million barrels. The report estimated current demand at 1,429,000 barrels per day, an increase (⬆) of 674,000 barrels daily from the previous report week.
Natural Gas
Natural gas in storage shows an excess supply available to the market at this time. The surplus, nearly 40% more than the average of the past five years, is bearish for price. The market is between seasons in the short term. But natural gas marketers will be servicing an economy that continues to be supported by very strong employment and, presumably, demand through the year. The question of where prices might go remains subject to considerable uncertainty.
Globalizing National Gas
Powerhouse has observed that natural gas’s position in global energy supply has shifted markedly as the commodity has globalized. The country has become the largest exporter of LNG in the world since 2023. Its impact on climate is more significant than before, and it is becoming the focus of Federal negotiations well beyond strictly energy matters.
One current example is the Administration’s push to get aid to Ukraine. Approvals for new LNG exports have been in abeyance this year, in response to climate activists’ concerns about its environmental impact. However, lifting the constraints could encourage energy-producing state legislators to support aid to Ukraine. The issue has been complicated by concerns that failure to encourage LNG exports could push some Asian economies to coal. LNG has become more important in supplying products to Europe instead of Russia, another goal of U.S. diplomacy.
Hurricanes ahead
Powerhouse tracks the prospects for hurricane activity each spring. The hurricane season opens officially on June 1, but hurricanes can develop at other times too.
This year, expert opinion leans strongly toward a more intense season than last year. A typical estimate, by AccuWeather, points toward 20-25 named storms this year. Last year, the Atlantic experienced 19 named storms. This year’s estimate includes eight to twelve hurricanes. These include the possibility of four to seven major hurricanes. Last year had seven hurricanes, of which only three were considered to be major weather events.
Rising sea surface temperatures in the Atlantic Basin are the most important factor in the guessing game. Warm water encourages the creation of hurricanes. One has to look back to 2020 to see what warm waters can do to weather.
Meteorologists are worried that hurricanes could arise before hurricane season. Warmer waters could extend the season, rather than a traditional slowing of hurricane activity in the autumn. Awareness and preparation are critical if one is to avoid the damage and danger that accompanies adverse weather.
According to the EIA:
- Net withdrawals from storage totaled 37 Bcf for the week ended March 29, compared with the five-year (2019–2023) average net withdrawals of 1 Bcf and last year’s net withdrawals of 29 Bcf during the same week. Working natural gas stocks totaled 2,259 Bcf, which is 633 Bcf (39%) more than the five-year average and 422 Bcf (23%) more than last year at this time.
- According to The Desk survey of natural gas analysts, estimates of the weekly net change to working natural gas stocks ranged from net withdrawals of 36 Bcf to 52 Bcf, with a median estimate of 43 Bcf.
Was this helpful? We’d like your feedback.
Please respond to [email protected]
This material has been prepared by a sales or trading employee or agent of Powerhouse Brokers, LLC and is, or is in the nature of, a solicitation. This material is not a research report prepared by Powerhouse Brokers, LLC. By accepting this communication, you agree that you are an experienced user of the futures markets, capable of making independent trading decisions, and agree that you are not, and will not, rely solely on this communication in making trading decisions.
DISTRIBUTION IN SOME JURISDICTIONS MAY BE PROHIBITED OR RESTRICTED BY LAW. PERSONS IN POSSESSION OF THIS COMMUNICATION INDIRECTLY SHOULD INFORM THEMSELVES ABOUT AND OBSERVE ANY SUCH PROHIBITION OR RESTRICTIONS. TO THE EXTENT THAT YOU HAVE RECEIVED THIS COMMUNICATION INDIRECTLY AND SOLICITATIONS ARE PROHIBITED IN YOUR JURISDICTION WITHOUT REGISTRATION, THE MARKET COMMENTARY IN THIS COMMUNICATION SHOULD NOT BE CONSIDERED A SOLICITATION.
The risk of loss in trading futures and/or options is substantial and each investor and/or trader must consider whether this is a suitable investment. Past performance, whether actual or indicated by simulated historical tests of strategies, is not indicative of future results. Trading advice is based on information taken from trades and statistical services and other sources that Powerhouse Brokers, LLC believes are reliable. We do not guarantee that such information is accurate or complete and it should not be relied upon as such. Trading advice reflects our good faith judgment at a specific time and is subject to change without notice. There is no guarantee that the advice we give will result in profitable trades.
Copyright 2024 Powerhouse Brokers, LLC, All rights reserved