Putting Things in Perspective
- Two-day price declines of this magnitude are rare
- Consensus is coalescing around the view that recession risks are rising
- OPEC+ production increases may be driven by multiple factors
- U.S. natural gas prices not immune from tariff fallout
Sincerely,
David Thompson, CMT
Executive Vice President
Powerhouse
(202) 333-5380
The Matrix
Last Thursday and Friday were momentous trading days for the energy sector. In two trading days, Brent crude oil fell by 12.5%. According to one bank, declines this large are uncommon. In the 9,677 trading days since the Brent crude oil futures began trading (June 1988) there have been just 24 occurrences of crude oil dropping 12.5% or more over two consecutive trading days. Unfortunately, 22 of those were associated with recessions.
The consensus of economists from the major banks believes that tariffs will raise costs to consumers and erode overall GDP for some period of time. At the same time OPEC+ is accelerating the rate at which they are bringing previously idled crude oil production back to the market. This may represent an attempt to reclaim market share from U.S. shale producers. Currently, OPEC+ has nearly 6 million barrels per day of spare capacity to deploy in this effort. Another factor driving the production increase may be the fact that since Aramco went public, Saudi Arabia now faces external market pressures. Aramco slashed its dividend 30% in March on falling profit levels.
The net results of these factors is that crude oil price targets are being lowered across Wall Street. One bank also cautions that because of their strong correlation to GDP, wholesale gasoline prices may also face pressure in this environment.
President Trump can pause or undo the tariff policies with a word. In fact, an erroneous tweet yesterday led to an 8.60% rally in the S&P 500 index in less than thirty minutes, crude oil gained 6.45% over the same short time frame. But if the tariff policies remain in force long enough, global trade flows may be altered – and perhaps in ways not envisioned by the Administration.

Supply/Demand Balances
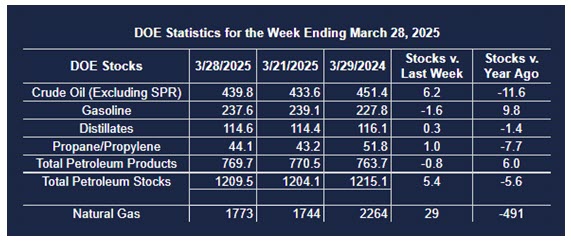
Supply/demand data in the United States for the week ended March 28, 2025, were released by the Energy Information Administration.
Total commercial stocks of petroleum increased (⬆) 5.4 million barrels to 1.2095 billion barrels during the week ended March 28th, 2025.
Commercial crude oil supplies in the United States were higher (⬆) by 6.2 million barrels from the previous report week to 439.8 million barrels.
Crude oil inventory changes by PAD District:
PADD 1: Down (⬇) 0.1 million barrels to 8.2 million barrels
PADD 2: Up (⬆) 3.1 million barrels to 108.6 million barrels
PADD 3: Up (⬆) 1.7 million barrels to 250.6 million barrels
PADD 4: Down (⬇) 0.5 million barrels to 24.1 million barrels
PADD 5: Up (⬆) 1.8 million barrels to 48.2 million barrels
Cushing, Oklahoma, inventories were up (⬆) 2.4 million barrels to 25.1 million barrels.
Domestic crude oil production increased (⬆) 6,000 barrels per day from the previous report at 13.580 million barrels per day.
Crude oil imports averaged 6.466 million barrels per day, a daily increase (⬆) of 271,000 barrels. Exports decreased (⬇) 728,000 barrels daily to 3.881 million barrels per day.
Refineries used 86.0% of capacity; a decrease (⬇) of 1.0% from the previous report week.
Crude oil inputs to refineries decreased (⬇) 192,000 barrels daily; there were 15.558 million barrels per day of crude oil run to facilities. Gross inputs, which include blending stocks, decreased (⬇) 181,000 barrels daily to 15.789 million barrels daily.
Total petroleum product inventories decreased (⬇) by 0.8 million barrels from the previous report week, up to 769.7 million barrels.
Total product demand increased (⬆) 885,000 barrels daily to 20.121 million barrels per day.
Gasoline stocks decreased (⬇) 1.6 million barrels from the previous report week; total stocks are 237.6 million barrels.
Demand for gasoline decreased (⬇) 148,000 barrels per day to 8.495 million barrels per day.
Distillate fuel oil stocks increased (⬆) 0.3 million barrels from the previous report week; distillate stocks are at 114.6 million barrels. EIA reported national distillate demand at 3.679 million barrels per day during the report week, an increase (⬆) of 43,000 barrels daily.
Propane stocks rose (⬆) 1.0 million barrels from the previous report to 44.1 million barrels. The report estimated current demand at 1,193,000 barrels per day, an increase (⬆) of 102,000 barrels daily from the previous report week.
Natural Gas
During the initial day of last week’s sell-off, natural gas may have attracted a bit of a safe haven bid as traders and investors sought to diversify away from oil exposure. This dynamic has not held and there is now concern among market participants that U.S. LNG exports may possibly be affected by retaliatory measures from countries that are subject to new U.S. tariffs. A broader economic decline would also reduce natural gas demand from the commercial and industrial sectors.
According to the EIA:
- Net injections into storage totaled 29 Bcf for the week ended March 28, compared with the five-year (2020–24) average net withdrawals of 13 Bcf and last year’s net withdrawals of 37 Bcf during the same week. Working natural gas stocks totaled 1,773 Bcf, which is 80 Bcf (4%) lower than the five-year average and 491 Bcf (22%) lower than last year at this time.
- According to The Desk survey of natural gas analysts, estimates of the weekly net change to working natural gas stocks ranged from net injections of 18 Bcf to 35 Bcf, with a median estimate of 25 Bcf.
Was this helpful? We’d like your feedback.
Please respond to [email protected]
This material has been prepared by a sales or trading employee or agent of Powerhouse Brokers, LLC and is, or is in the nature of, a solicitation. This material is not a research report prepared by Powerhouse Brokers, LLC. By accepting this communication, you agree that you are an experienced user of the futures markets, capable of making independent trading decisions, and agree that you are not, and will not, rely solely on this communication in making trading decisions.
DISTRIBUTION IN SOME JURISDICTIONS MAY BE PROHIBITED OR RESTRICTED BY LAW. PERSONS IN POSSESSION OF THIS COMMUNICATION INDIRECTLY SHOULD INFORM THEMSELVES ABOUT AND OBSERVE ANY SUCH PROHIBITION OR RESTRICTIONS. TO THE EXTENT THAT YOU HAVE RECEIVED THIS COMMUNICATION INDIRECTLY AND SOLICITATIONS ARE PROHIBITED IN YOUR JURISDICTION WITHOUT REGISTRATION, THE MARKET COMMENTARY IN THIS COMMUNICATION SHOULD NOT BE CONSIDERED A SOLICITATION.
The risk of loss in trading futures and/or options is substantial and each investor and/or trader must consider whether this is a suitable investment. Past performance, whether actual or indicated by simulated historical tests of strategies, is not indicative of future results. Trading advice is based on information taken from trades and statistical services and other sources that Powerhouse Brokers, LLC believes are reliable. We do not guarantee that such information is accurate or complete and it should not be relied upon as such. Trading advice reflects our good faith judgment at a specific time and is subject to change without notice. There is no guarantee that the advice we give will result in profitable trades.
Copyright 2025 Powerhouse Brokers, LLC, All rights reserved