New Global COVID-19 Threats Boost Price Uncertainty
- European lockdowns expanding
- U.S. crude oil production grows
- OPEC+ agrees to increase production
- Natural gas prices in Asia reach recent highs

Alan Levine—Chairman, Powerhouse
(202) 333-5380
The Matrix
Oil prices are being influenced by an unusually broad set of factors. Oil demand may be buffeted going forward as the spread of new COVID-19 variants collides with expanding rates of vaccinations. However, inefficiencies in vaccine distribution between regions and countries introduce a new factor of uncertainty to pricing.
Supply is facing its own challenges. OPEC+ had been expected to constrain output to support prices. Last week, however, an expansion of crude oil supply was announced. The increase reflected a call by the U.S for more supply: 1.1 million barrels per day should be available by July.
Markets in Europe are likely to be constricted by a new round of lockdowns in response to renewed COVID-19 infections and uneven rollouts of vaccines in the region.
Germany has extended its lockdown until mid-April. France is also in a lockdown. Italy, Austria, Norway and Switzerland are also using quarantines in one form or another. It is possible that these barriers could reduce consumption by about one million barrels per day.
Some price analysts have expected U.S. shale oil producers to limit drilling to support paying dividends to investors. This would be bullish, but data from the Energy Information Administration suggest this investor’s dream may be illusory.
DOE’s weekly supply/demand report for the week ended March 26, shows further recovery in domestic production.

U.S. Crude Production 1984 – 2021 Source: EIA
Domestic production during March 2020 topped out at 13.0 million barrels per day. As the pandemic spread, production fell. It bottomed at 10.3 million barrels daily early in September. Output has recovered to 11.0 million barrels per day.
The play of economic and biological forces at work in the world challenge policymakers in these specialties. The objectives of public health and national economic policy may not—and often do not—mesh. The global reach of COVID-19 complicates administration of the pandemic. And complexity itself could find a place in the pricing of petroleum as we go through the recovery year of 2021.
Supply/Demand Balances
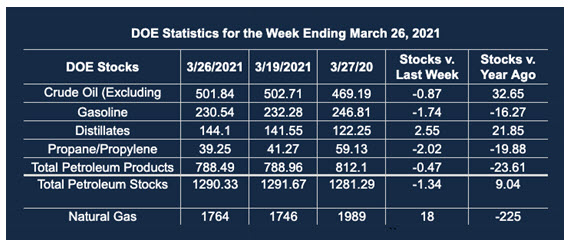
Supply/demand data in the United States for the week ended March 26, 2021, were released by the Energy Information Administration.
Total commercial stocks of petroleum fell by 1.3 million barrels during the week ended March 26, 2021.
Commercial crude oil supplies in the United States decreased by 0.9 million barrels from the previous report week to 501.8 million barrels.
Crude oil inventory changes by PAD District:
PADD 1: UNCH at 8.7 million barrels
PADD 2: Down 1.5 million barrels to 129.4 million barrels
PADD 3: Plus 0.8 million barrels to 294.4 million barrels
PADD 4: Plus 1.0 million barrels to 23.2 million barrels
PADD 5: Down 1.3 million barrels to 46.1 million barrels
Cushing, Oklahoma, inventories were up 0.8 million barrels from the previous report week to 47.1 million barrels.
Domestic crude oil production was up 100,000 barrels daily from the previous report week to 11.1 million barrels daily.
Crude oil imports averaged 6.145 million barrels per day, a daily increase of 523,000 barrels. Exports increased 693,000 barrels daily to 3.174 million barrels per day.
Refineries used 83.9% of capacity, up 2.3% from the previous report week.
Crude oil inputs to refineries increased 552,000 barrels daily; there were 14.941 million barrels per day of crude oil run to facilities. Gross inputs, which include blending stocks, rose 408,000 barrels daily to 15.419 million barrels daily.
Total petroleum product inventories fell 0.4 million barrels from the previous report week.
Gasoline stocks fell 1.7 million barrels from the previous report week; total stocks are 230.5 million barrels.
Demand for gasoline rose 275,000 barrels per day to 8.891 million barrels per day.
Total product demand increased 1.611 million barrels daily to 20.313 million barrels per day.
Distillate fuel oil stocks rose 2.5 million barrels from the previous report week; distillate stocks are at 144.1 million barrels. EIA reported national distillate demand at 4.113 million barrels per day during the report week, an increase of 521,000 barrels daily.
Propane stocks fell 2.0 million barrels from the previous report week; propane stocks fell to 39.2 million barrels. The report estimated current demand at 1.676 million barrels per day, an increase of 492,000 barrels daily from the previous report week.
Natural Gas
A period of flat natural gas futures trading began in the middle of March supported around $2.50. After the release of the IEA storage report last week, prices moved above $2.60 resistance, topping at $2.688. Prices have since eased down, but the natural gas bulls appear to have awakened.
One indication is the situation in Europe and Asia, where prices have moved up to levels not seen in about two years. One consultant notes that LNG exports could exceed last year at this time by seven Bcf/d. Manufacturing demand will also exceed last year’s use because of the recovery from COVID-19.
According to the EIA:
The net injections into [natural gas] storage totaled 14 Bcf for the week ended March 26, compared with the five-year (2016–2021) average net withdrawals of 24 Bcf and last year’s net withdrawals of 20 Bcf during the same week. Working natural gas stocks totaled 1,764 Bcf, which is 36 Bcf lower than the five-year average and 225 Bcf lower than last year at this time.
According to The Desk survey of natural gas analysts, estimates of the weekly net change to working natural gas stocks ranged from net injections of 11 Bcf to 41 Bcf, with a median estimate of 21 Bcf.
Was this helpful? We’d like your feedback.
Please respond to [email protected]
Powerhouse Futures & Trading Disclaimer
Copyright 2021 Powerhouse Brokerage, LLC, All rights reserved