Bearish Signs Emerging for Oil Sector
- Energy futures prices fell last week
- Crude oil stocks fell
- Concerns over economic growth develop
- Consumption and climate clash in natural gas outlook
Sincerely,
Alan Levine, Chairman
Powerhouse
(202) 333-5380

The Matrix
Core energy futures prices fell last week. A few weeks of indecisive trading broke sharply lower for the week ended April 21. WTI spot futures wound up at $77.87 per barrel. (Product price losses were $0.15 for ULSD, settling at $2.4886 and $0.2343 for RBOB, a settle of $2.6016.)
When OPEC+ announced its production cut at the end of March, spot futures soared. WTI created a $3.72 “gap” in price charts between $75.72 and $79.00 over that weekend. The gap was an area where no trading took place. As prices fell, the gap began to fill. It served as a target, pulling prices lower.
Still, crude oil storage took a hit according to the U.S. Petroleum Balance Sheet for the Week Ended April 14, 2023. Commercial crude oil inventories fell 4.6 million barrels and oil in the SPR dropped another 1.6 million barrels during the report week. Some of the reductions were largely offset by a (+1.3 million barrel) gain in gasoline supply and a similar (+1.8 million barrel) increase in Other Oils, the EIA’s balancing item.
There were several reasons suggested for the bearish week. Concerns over slowing economic growth have resurfaced. Indications that the SPR refill could be delayed weighed on prices. Filling the SPR remains problematic. Prices need to reach $70 per barrel to trigger purchasing plans. Moreover, maintenance of the reserve infrastructure while storage is half full must be undertaken. And a previously announced sale of 26 million more barrels must be completed by the end of the second quarter.

The winter just ending has been notable for its failure to generate Heating Degree Days, contributing to reduced demand. But in the larger distillate fuel oil economy, manufacturing and consequently, freight use has fallen since last year’s third quarter. Higher interest rates and strength of the dollar have pressured consumption as well.
Declining consumption is not a recipe for price strength, nor is anxiety about economic health. But global conflict is. Friction among China, emerging from its Covid-induced isolation, Russia seeking a return to its Soviet imperium, and the traditional Western allies are already a reality. It is not clear how fractious things could become.
Supply/Demand Balances
Supply/demand data in the United States for the week ended April 14, 2023, were released by the Energy Information Administration.
Total commercial stocks of petroleum fell (⬇) 0.4 million barrels to 1.234 billion barrels during the week ended April 14, 2023.
Commercial crude oil supplies in the United States were lower (⬇) by 4.6 million barrels from the previous report week to 466.0 million barrels.
Crude oil inventory changes by PAD District:
PADD 1: Plus (⬆) 0.2 million barrels to 7.6 million barrels
PADD 2: Down (⬇) 1.4 million barrels to 118.6 million barrels
PADD 3: Down (⬇) 2.2 million barrels to 265.3 million barrels
PADD 4: Down (⬇) 0.4 million barrels at 25.0 million barrels
PADD 5: Down (⬇) 0.8 million barrels to 49.4 million barrels
Cushing, Oklahoma, inventories were down (⬇) 1.0 million barrels from the previous report week to 32.8 million barrels.
Domestic crude oil production was unchanged (=) at 12.3 million barrels daily.
Crude oil imports averaged 6.294 million barrels per day, a daily increase (⬆) of 101,000 barrels. Exports increased (⬆) 1.844 million barrels daily to 4.571 million barrels per day.
Refineries used 91.0% of capacity; 1.7 percentage points higher (⬆) than the previous report week.
Crude oil inputs to refineries increased (⬆) 260,000 barrels daily; there were 15.844 million barrels per day of crude oil run to facilities. Gross inputs, which include blending stocks, rose (⬆) 307,000 barrels daily to 16.440 million barrels daily.
Total petroleum product inventories rose (⬆) by 4.0 million barrels from the previous report week, falling to 768.2 million barrels.
Total product demand increased (⬆) 263,000 barrels daily to 19.317 million barrels per day.
Gasoline stocks increased (⬆) 1.3 million barrels from the previous report week; total stocks are 223.5 million barrels.
Demand for gasoline decreased (⬇) 416,000 barrels per day to 8.519 million barrels per day.
Distillate fuel oil stocks decreased (⬇) 0.4 million barrels from the previous report week; distillate stocks are at 112.1 million barrels. EIA reported national distillate demand at 3.765 million barrels per day during the report week, an increase (⬆) of 3,000 barrels daily.
Propane stocks decreased (⬇) by 0.7 million barrels from the previous report week to 55.5 million barrels. The report estimated current demand at 869,000 barrels per day, a decrease (⬇) of 106,000 barrels daily from the previous report week.
Natural Gas
An attempt to rally Henry Hub spot futures prices last week ran out of steam midweek. And injections into underground storage, at 75 Bcf, did not help the bulls. The additions to storage exceeded industry expectations by 5 Bcf, providing a 34% surplus over last year’s storage at this time. The week ended with prices at $2.23, midway between nearby support at $1.95 and resistance of $2.38.
Degree day data have been indecisive in recent days. Heating degree days have failed to produce significant natural gas demand, and Cooling Degree days have yet to raise unusual demand for summer cooling.
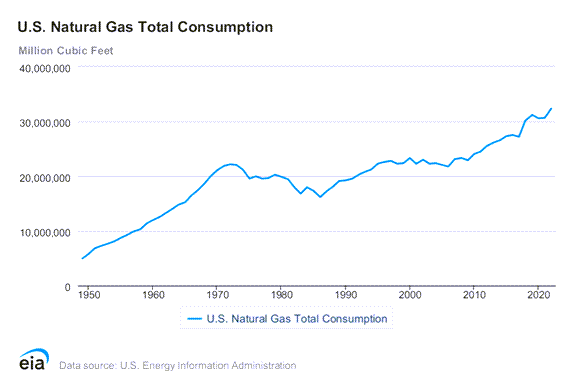
Broader economic and geographic considerations continue to hold natural gas use in a dynamic tension between climate preservation and expanding demand for natural gas. Ironically, the gains in natural gas reflect its use in lieu of coal as a generator of electricity. Some estimate that natural gas creates half the carbon dioxide emissions of coal. Methane is, nonetheless, a major source of greenhouse gas.
Global demand growth for American supplies of liquified natural gas has also responded to the European situation. Reluctance to oppose Russian aggression in post-Soviet Europe intensified regional reliance on Russian natural gas. Ukraine appears to have become a tipping point. Various limitations on Russian exports of oil and natural gas left the EU exposed to fuel shortages last year as winter approached. The United States reportedly provided half of Europe’s natural gas in 2022 (and 12% of its liquid oils.)
Expanding markets for American LNG and American leadership on the climate crisis are in conflict. The Administration has approved two new LNG projects in Texas. The FERC has certified both over objections from environmental groups and some nearby communities.
Spending for a cleaner environment has become a tool in the debt ceiling debate. While FERC approves LNG expansion, the Inflation Reduction Act provides clean energy tax credits that would work against fossil fuels. Energy-producing states benefit from new fossil fuel production; clean air advocates are more generally distributed throughout the country. Domestic calls for a clean climate are thus a factor in the debt ceiling conversation.
According to the EIA:
Net [natural gas] injections into storage totaled 75 Bcf for the week ended April 14, compared with the five-year (2018–2022) average net injections of 41 Bcf and last year’s net injections of 47 Bcf during the same week. Working natural gas stocks totaled 1,930 Bcf, which is 329 Bcf (21%) more than the five-year average and 488 Bcf (34%) more than last year at this time.
According to The Desk survey of natural gas analysts, estimates of the weekly net change to working natural gas stocks ranged from net injections of 60 Bcf to 82 Bcf, with a median estimate of 70 Bcf.
Was this helpful? We’d like your feedback.
Please respond to [email protected]
Powerhouse Futures & Trading Disclaimer
Copyright 2023 Powerhouse Brokerage, LLC, All rights reserved