Oil Price Steady as Tug-of-War Holds
- OPEC+ gets a 10 million barrel cut
- New candidates for a supply cut are Texas and Oklahoma
- Expect global fuel demand down 30 percent
- U.S. Gasoline demand collapses to 5.1 million barrels daily
- Natural gas in substantial carry

The Matrix
Energy markets throughout the world are being shaken by an unusual set of price considerations. Global crude oil interests are seeking a formula that will bring oil production down to support price. Saudi Arabia is leading an effort to shut-in at least 10 million barrels of crude oil daily.
Russia, part of the OPEC+ group, has apparently joined with Saudi Arabia seeking to reduce global supply by even more. Quantities as high as 20 million daily barrels were mentioned. Taking that amount from global supply, even if successful, would be problematical because demand for oil has collapsed.
In seeking consensus, OPEC+ has reached out to some producers not usually thought of as part of any producer agreement. These include the United States, separately Texas and Oklahoma, Canada and Mexico.
North American producers are shying away from explicit agreements. Canada, for example, is cutting production, but largely because of unattractive market forces. The United States will not reduce output noting that EIA projects output to fall by two million barrels in 2020.
One overriding consideration, however, puts the success or failure of OPEC+’s initiative at risk. Negotiators insist that action to cut production must be taken by all participants. This is a high bar.
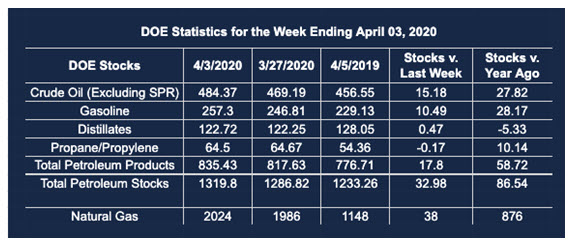
World-wide fuel demand has reportedly fallen by 30 percent in recent weeks. The EIA’s most recent U.S. Petroleum Balance Sheet for the week ending April 3rd showed total domestic oil demand at 14.4 million barrels daily. This was a weekly loss of 3.4 million barrels per day.
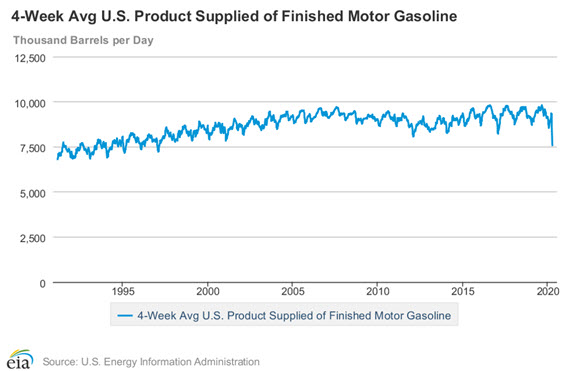
4-Week Avg Gasoline Supplied 1990 – 2020 source: US Dept. of Energy – EIA
Gasoline use came in at 5.1 million barrels daily. The 4-week average showed gasoline demand at 7.3 million barrels per day. This average was last seen on April 3, 1997. The 2.2 million difference between weekly gasoline demand and 4-week average demand shows how rapidly CD-19 countermeasures have impacted gasoline demand.
Futures have not yet taken a stand on where prices might go. Crude oil has been trading just above support at $20. RBOB reached major support at $0.3760 on March 25th (lesser support is around $0.50.) HO support is about $0.93, trading now just under a buck.
Supply/Demand Balances
Supply/demand data in the United States for the week ending April 3, 2020, were released by the Energy Information Administration.
Total commercial stocks of petroleum rose by 33.0 million barrels during the week ending April 3, 2020.
Commercial crude oil supplies in the United States increased by 15.2 million barrels from the previous report week to 484.4 million barrels.
Crude oil inventory changes by PAD District:
PADD 1: Plus 0.5 million barrels to 12.0 million barrels
PADD 2: Plus 7.4 million barrels to 141.8 million barrels
PADD 3: Plus 5.3 million barrels to 253.1 million barrels
PADD 4: Plus 1.0 from the previous report week t0 22.8 million barrels
PADD 5: Plus 1.0 million barrels to 54.7 million barrels
Cushing, Oklahoma inventories were up 6.6 million barrels from the previous report week to 49.2 million barrels.
Domestic crude oil production was fell 0.6 million barrels per day from the previous report week to 12.4 million barrels daily.
Crude oil imports averaged 5.874 million barrels per day, a daily decrease of 173,000 barrels. Exports fell 322,000 barrels daily to 2.833 million barrels per day.
Refineries used 75.6 percent of capacity, down 6.7% from the previous report week.
Crude oil inputs to refineries decreased 1.264 million barrels daily; there were 13.634 million barrels per day of crude oil run to facilities. Gross inputs, which include blending stocks, fell 1.265 million barrels daily to reach 14.216 million barrels daily.
Total petroleum product inventories rose 17.8 million barrels from the previous report week.
Gasoline stocks increased 10.5 million barrels daily from the previous report week; total stocks are 257.3 million barrels.
Demand for gasoline fell 1.595 million barrels per day to 5.065 million barrels per day.
Total product demand decreased 3.401 million barrels daily to 14.446 million barrels per day.
Distillate fuel oil stocks increased 0.5 million barrels from the previous report week; distillate stocks are at 122.7 million barrels. EIA reported national distillate demand at 3.807 million barrels per day during the report week, a decrease of 101,000 barrels daily.
Propane stocks decreased 0.2 million barrels from the previous report week; propane stocks are 64.5 million barrels. The report estimated current demand at 1.096 million barrels per day, a decrease of 256,000 barrels daily from the previous report week.
Natural Gas
Natural gas prices are facing the same market woes as are those of petroleum liquids. Current prices are trading around $1.73, a deep discount to next winter, where February, 2021 is $2.86. The hefty carry for February prices (+$1.13) is greater than the cost of storage for that period. And some analysts expect the end of this summer’s injection period to be burdened total U.S. working storage of 4 Tcf.
The large difference between now and next winter creates an opportunity for those with access to storage. Traders may buy natural gas now and store it, fixing a margin greater than the cost of holding supply.
According to EIA:
The net injection into storage totaled 38 Bcf for the week ending April 3, compared with the five-year (2015–19) average net injection of 6 Bcf and last year’s net injection of 25 Bcf during the same week. Working natural gas stocks totaled 2,024 Bcf, which is 324 Bcf more than the five-year average and 876 Bcf more than last year at this time.
Futures trading involves significant risk and is not suitable for everyone. Transactions in securities futures, commodity and index futures and options on future markets carry a high degree of risk. The amount of initial margin is small relative to the value of the futures contract, meaning that transactions are heavily “leveraged”. A relatively small market movement will have a proportionately larger impact on the funds you have deposited or will have to deposit: this may work against you as well as for you. You may sustain a total loss of initial margin funds and any additional funds deposited with the clearing firm to maintain your position. If the market moves against your position or margin levels are increased, you may be called upon to pay substantial additional funds on short notice to maintain your position. If you fail to comply with a request for additional funds within the time prescribed, your position may be liquidated at a loss and you will be liable for any resulting deficit. Past performance may not be indicative of future results. This is not an offer to invest in any investment program.
Powerhouse is a registered affiliate of Coquest, Inc.
Was this helpful? We’d like your feedback.
Please respond to [email protected]
Copyright© 2020 Powerhouse, All rights reserved.