Forecast Highlights
Global liquid fuels
- The April Short-Term Energy Outlook (STEO) is subject to heightened levels of uncertainty resulting from a variety of factors, including Russia’s further invasion of Ukraine. This STEO assumes U.S. GDP will grow by 3.4% in 2022 and by 3.1% in 2023, following growth of 5.7% in 2021. We use the S&P Global macroeconomic model to generate our U.S. economic assumptions. Global macroeconomic assumptions in our forecast are from Oxford Economics and include global GDP growth of 4.0% in 2022 and 3.7% in 2023, compared with growth of 6.0% in 2021. A wide range of potential macroeconomic outcomes could significantly affect energy markets during the forecast period. Energy supply uncertainty results from the conflict in Ukraine, the production decisions of OPEC+, and the rate at which U.S. oil and natural gas producers increase drilling.
- The Brent crude oil spot price averaged $117 per barrel (b) in March, a $20/b increase from February. Crude oil prices increased following the further invasion of Ukraine by Russia. Sanctions on Russia and other actions contributed to falling oil production in Russia and created significant market uncertainties about the potential for further oil supply disruptions. These events occurred against a backdrop of low oil inventories and persistent upward oil price pressures. Global oil inventory draws averaged 1.7 million barrels per day (b/d) from the third quarter of 2020 (3Q20) through the end of 2021. We estimate that commercial oil inventories in the OECD ended 1Q22 at 2.61 billion barrels, up slightly from February, which was the lowest level since April 2014.

- We expect the Brent price will average $108/b in 2Q22 and $102/b in the second half of 2022 (2H22). We expect the average price to fall to $93/b in 2023. However, this price forecast is highly uncertain. Actual price outcomes will depend on the degree to which existing sanctions imposed on Russia, any potential future sanctions, and independent corporate actions affect Russia’s oil production or the sale of Russia’s oil in the global market. In addition, the degree to which other oil producers respond to current oil prices, as well as the effects macroeconomic developments might have on global oil demand, will be important for oil price formation in the coming months. Although we reduced Russia’s oil production in our forecast, we still expect that global oil inventories will build at an average rate of 0.5 million b/d from 2Q22 through the end of 2023, which we expect will put downward pressure on crude oil prices. However, if production disruptions—in Russia or elsewhere—are more than we forecast, the resulting crude oil prices would be higher than our current forecast.
- We estimate that 98.3 million b/d of petroleum and liquid fuels was consumed globally in March 2022, an increase of 2.4 million b/d from March 2021. We forecast that global consumption of petroleum and liquid fuels will average 99.8 million b/d for all of 2022, which is a 2.4 million b/d increase from 2021. However, this forecast is down by 0.8 million b/d from last month’s forecast as a result of downward revisions to global GDP growth from Oxford Economics. We forecast that global consumption of petroleum and liquid fuels will rise by 1.9 million b/d in 2023 to average 101.7 million b/d. The outlook for economic growth and oil consumption in Russia and surrounding countries continues to be highly uncertain.

- We are publishing the Summer Fuels Outlook as a supplement to this STEO. We expect U.S. prices for retail gasoline will average $3.84 per gallon (gal) this summer (April–September), which would be up from $3.06/gal last summer and the highest price (adjusted for inflation) since the summer of 2014. Retail diesel prices for the summer average $4.57/gal in the forecast, which would also be the highest inflation-adjusted price for the summer since 2014.
- U.S. crude oil production in the forecast averages 12.0 million b/d in 2022, up 0.8 million b/d from 2021. We forecast production to increase another 0.9 million b/d in 2023 to average almost 13.0 million b/d, surpassing the previous annual average record of 12.3 million b/d set in 2019.
Natural Gas
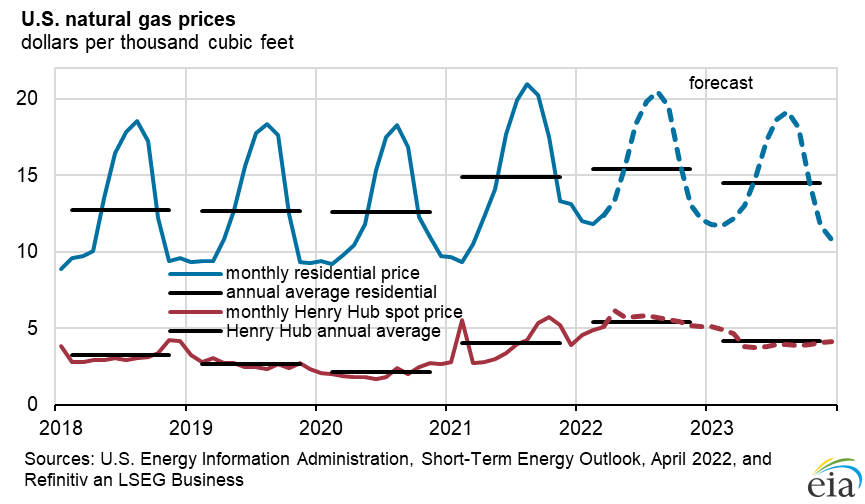
- In March, the Henry Hub natural gas spot price averaged $4.90 per million British thermal units (MMBtu), which was up from the February average of $4.69/MMBtu, as inventory withdrawals slightly outpaced the five-year (2017–2021) average. We expect liquefied natural gas (LNG) exports will increase from March levels, contributing to a Henry Hub price of $5.95/MMBtu for April. We expect the Henry Hub price will average $5.68/MMBtu in 2Q22 and $5.23/MMBtu for all of 2022. We expect the Henry Hub spot price will average $4.01/MMBtu in 2023. The forecast drop in prices for 2023 reflects our expectation that storage levels will be higher during 2023 than in 2022.
- We estimate that natural gas inventories ended March at 1.4 trillion cubic feet (Tcf), which is 17% below the five-year (2017–2021) average. Inventory withdrawals in March were 203 billion cubic feet (Bcf), resulting from relatively flat production and rising natural gas exports. We expect natural gas inventories to increase by 245 Bcf in April, as the injection season begins, ending the month at about almost 1.7 Tcf, which would be 14% below the five-year average for this time of year. We forecast that natural gas inventories will end the 2022 injection season (end of October) at 3.5 Tcf, which is 4% below the five-year average.
- In March, U.S. LNG exports averaged 11.9 billion cubic feet per day (Bcf/d), an increase of 0.7 Bcf/d from February. LNG prices in Europe remain high amid supply uncertainties due to Russia’s further invasion of Ukraine and the need to replenish Europe’s natural gas inventories, which has kept Europe’s demand for LNG elevated. Inventories in Europe were 26% full as of March 31, compared with the five-year average of 34%. We expect high levels of U.S. LNG exports to continue in 2022, averaging 12.2 Bcf/d for the year, a 25% increase from 2021.
- We expect that U.S. consumption of natural gas will average 84.1 Bcf/d in 2022, up 1% from 2021. The increase in U.S. natural gas consumption is a result of colder forecast temperatures in 2022 compared with 2021, which results in more consumption in the residential and commercial sectors. In addition, we expect the industrial sector to consume more natural gas in 2022 in response to expanding economic activity. We expect U.S. natural gas consumption will average 84.7 Bcf/d in 2023.
- We estimate dry natural gas production averaged 96.2 Bcf/d in the United States in March, up 1.2 Bcf/d from February. Similar to January and February, production in March was lower than in December because of brief periods of freezing temperatures in certain production regions and, in part, because of maintenance, according to public sources. We forecast dry natural gas production to average 96.9 Bcf/d in April. For all of 2022, we expect that dry natural gas production will average 97.4 Bcf/d, which would be 3.8 Bcf/d more than in 2021. We expect dry natural gas production to average of 100.9 Bcf/d in 2023.