Forecast Highlights
Release Date: Nov. 10, 2020
Global liquid fuels
- The November Short-Term Energy Outlook (STEO) remains subject to heightened levels of uncertainty because responses to COVID-19 continue to evolve. Reduced economic activity related to the COVID-19 pandemic has caused changes in energy demand and supply patterns in 2020 and will continue to affect these patterns in the future. U.S. gross domestic product (GDP) declined by 4.4% in the first half of 2020 compared with the same period a year ago. GDP began rising in the third quarter of 2020, and this STEO assumes it will grow by 3.7% from 2020 to 2021. The U.S. macroeconomic assumptions in this outlook are based on forecasts by IHS Markit.
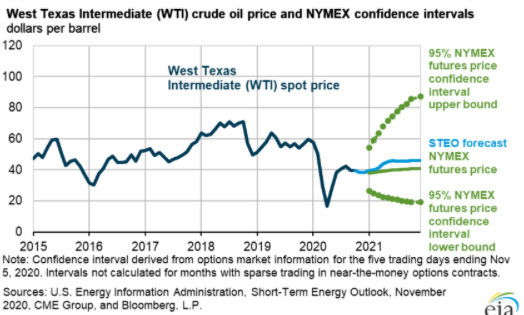
- Brent crude oil spot prices averaged $40 per barrel (b) in October, down $1/b from the average in September. Brent prices fell in October as previously disrupted crude oil production in Libya came back online and as COVID-19 cases began increasing in many countries, which could reduce oil demand in the coming months. Despite these developments, the U.S. Energy Information Administration (EIA) expects global oil inventories to continue falling in the coming months. However, EIA expects high global oil inventory levels and surplus crude oil production capacity will limit upward pressure on oil prices and that Brent prices will remain near $40/b through the end of 2020. EIA expects that as global oil demand rises, forecast inventory draws in 2021 will cause some upward oil price pressures. EIA forecasts Brent crude oil prices will average $47/b in 2021.
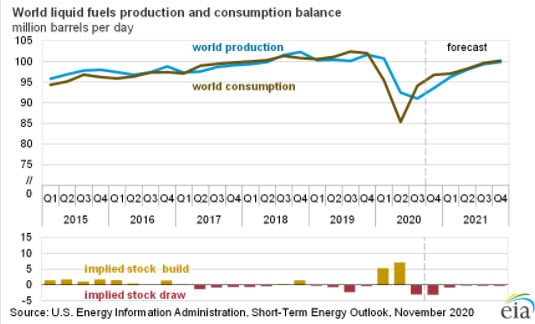
- EIA estimates that an average of 95.3 million barrels per day (b/d) of petroleum and liquid fuels was consumed globally in October. Liquid fuels consumption was down 5.9 million b/d from October 2019, but it was up from both the third-quarter 2020 average of 94.1 million b/d and the second-quarter 2020 average of 85.3 million b/d. EIA forecasts that global consumption of petroleum and liquid fuels will average 92.9 million b/d for all of 2020, down by 8.6 million b/d from 2019, before increasing by 5.9 million b/d in 2021.
- EIA reported that 10.6 million b/d of crude oil was produced in the United States in August (the most recent month for which historical data are available), down 0.4 million b/d from July. Production fell in August mainly because hurricanes disrupted production from the U.S. Gulf of Mexico. EIA reported that U.S. crude oil production in the Gulf of Mexico averaged 1.2 million b/d in August, down 0.5 million b/d from July. Since reaching a two-and-a-half year low of 10.0 million b/d in May, when producers curtailed wells, U.S. crude oil production has increased mainly because tight oil operators have brought wells back online in response to rising prices. EIA estimates that production will rise to 11.2 million b/d in November. However, EIA expects U.S. crude oil production to generally decline to an average of 11.0 million b/d in the second quarter of 2021 because new drilling activity will not generate enough production to offset declines from existing wells. EIA expects drilling activity to rise later in 2021, contributing to U.S. crude oil production reaching 11.3 million b/d in the fourth quarter of 2021. On an annual average basis, EIA expects U.S. crude oil production to fall from 12.2 million b/d in 2019 to 11.4 million b/d in 2020 and 11.1 million b/d in 2021.
Natural Gas
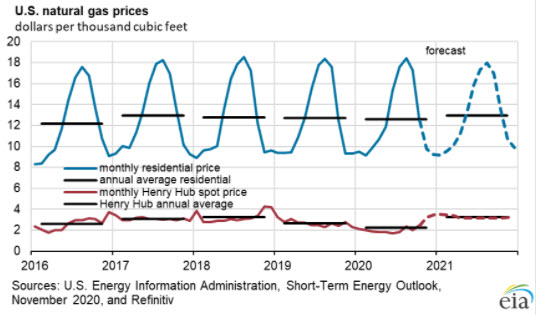
- In October, the Henry Hub natural gas spot price averaged $2.39 per million British thermal units (MMBtu), up from an average of $1.92/MMBtu in September. Higher natural gas spot prices reflected stronger demand for liquefied natural gas (LNG) exports as LNG terminals increased liquefaction following hurricane-related disruptions in August and September. EIA expects Henry Hub spot prices to rise to a monthly average of $3.42/MMBtu in January 2021 because of rising domestic demand for natural gas for space heating, rising U.S. LNG exports, and reduced production. EIA expects that monthly average spot prices will remain higher than $3.00/MMBtu throughout 2021, averaging $3.14/MMBtu for the year, up from a forecast average of $2.14/MMBtu in 2020.
- EIA estimates that total U.S. working natural gas in storage ended October at almost 4.0 trillion cubic feet (Tcf), 5% more than the five-year (2015–19) average and the secondhighest end-of-October level on record. However, because EIA forecasts less U.S. natural gas production this winter than last winter, EIA forecasts that inventory draws will outpace the five-year average during the heating season (October–March) and end March 2021 at 1.5 Tcf, which would be 16% lower than the 2016–20 average.
- EIA expects that total U.S. consumption of natural gas will average 83.7 billion cubic feet per day (Bcf/d) in 2020, down 1.7% from 2019. The decline in total U.S. consumption reflects less heating demand in early 2020, contributing to residential demand in 2020 averaging 13.2 Bcf/d (down 0.6 Bcf/d from 2019) and commercial demand in 2020 averaging 8.8 Bcf/d (down 0.9 Bcf/d from 2019). EIA forecasts industrial consumption will average 22.5 Bcf/d in 2020, down 0.6 Bcf/d from 2019 as a result of reduced manufacturing activity. EIA expects total U.S. natural gas consumption will average 79.4 Bcf/d in 2021, a 5.2% decline from 2020. The expected decline in 2021 is the result of rising natural gas prices that will reduce demand for natural gas in the electric power sector.
- EIA forecasts U.S. dry natural gas production will average 91.0 Bcf/d in 2020, down from an average of 93.1 Bcf/d in 2019. In the forecast, monthly average production falls from a record 97.0 Bcf/d in December 2019 to 87.0 Bcf/d in April 2021 before increasing slightly. EIA forecasts dry natural gas production in the United States to average 87.9 Bcf/d in 2021. EIA expects production to begin rising in the second quarter of 2021 in response to higher natural gas and crude oil prices. The increase in crude oil prices is expected to raise associated gas production from oil-directed wells in late-2021, especially in the Permian region.
- EIA estimates that the United States exported 7.2 Bcf/d of LNG in October, an increase of 2.3 Bcf/d from September—the largest month-on-month increase since U.S. LNG exports began in 2016. Cameron LNG resumed LNG exports in October after being shut down following Hurricane Laura and Hurricane Delta. Cove Point LNG completed its scheduled three-week annual maintenance and resumed LNG exports in mid-October. Higher global forward prices for LNG indicate improving netbacks for buyers of U.S. LNG in European and Asian markets for the upcoming winter season. The increased prices come amid expectations of natural gas demand recovery in those markets and potential LNG supply reductions because of outages at several LNG export facilities in the Pacific Basin and Atlantic Basin. EIA forecasts that U.S. LNG exports will be above pre-COVID levels in November 2020, averaging 8.5 Bcf/d, and will average 8.4 Bcf/d in 2021, a 31% increase from 2020.