This is a regular monthly supplement to the EIA Short-Term Energy Outlook. It covers both crude and refined products.
EIA contact: James Preciado ([email protected])
Click Here for the full report.
Crude Oil
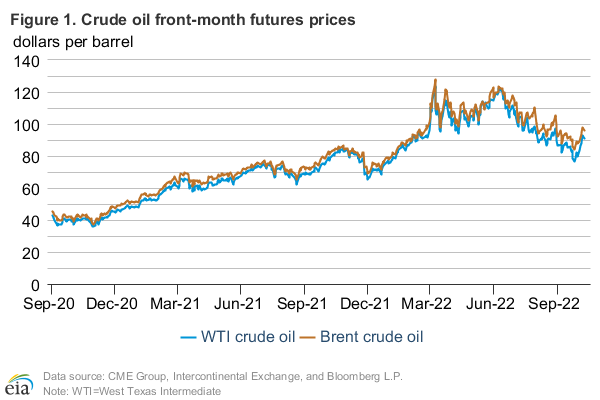
Prices: International crude oil futures prices increased slightly over the previous month but remained rangebound. The North Sea Brent front month futures price settled at $108.79 per barrel (bbl) on June 5, an increase of $1.03/bbl from May 1 (Figure 1). The front month West Texas Intermediate (WTI) contract also rose, settling at $102.48/bbl on June 5, $3.06/bbl higher than on May 1.
Lower-than-previously expected non-OPEC production growth going into the seasonal summer tightening of crude oil markets and generally positive economic data combined to push oil prices near the top of their recent trading range. The June forecast for 2014 non-OPEC liquid production is about 500,000 bbl/d lower compared to expectations at the start of the year, potentially leading to reduced spare production capacity in the summer months. Additionally, U.S. durable goods orders and consumer sentiment exceeded expectations, while monetary easing by the European Central Bank combined to increase expectations for future economic growth.
The Brent-WTI spread decreased over the previous month to settle at $6.31/bbl on June 5 (Figure 2). The decline was largely due to U.S. Gulf Coast (PADD 3) crude oil prices strengthening against international benchmarks. The Brent-Light Louisiana Sweet (LLS) price spread settled at $3.51/bbl on June 5, narrowing by $2.68/bbl since May 1. The higher spread at the beginning of May led to a drop in PADD 3 imports. The four-week average of commercial crude oil imports for PADD 3 dropped to 3.18 MMbbl/d for the week ending May 16, its lowest level since 1992. With the recent narrowing of the Brent-LLS differential, PADD 3 imports could increase in the coming weeks as the Gulf Coast crude oil market prepares for the seasonal summer peak in refinery runs.
The LLS-WTI spread moved higher in May but still remains below the cost to move crude oil from Cushing, Oklahoma, to St. James, Louisiana. The spread settled at $3.20/bbl on June 5.
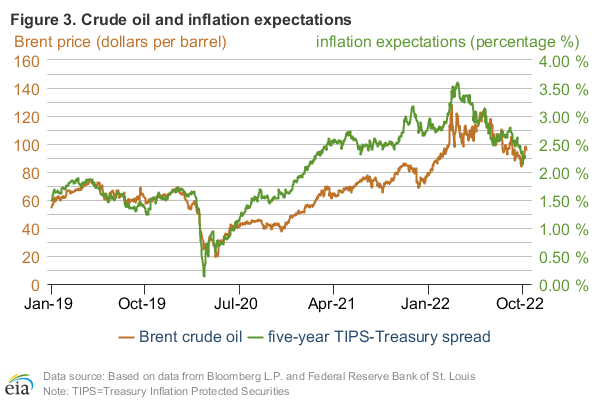
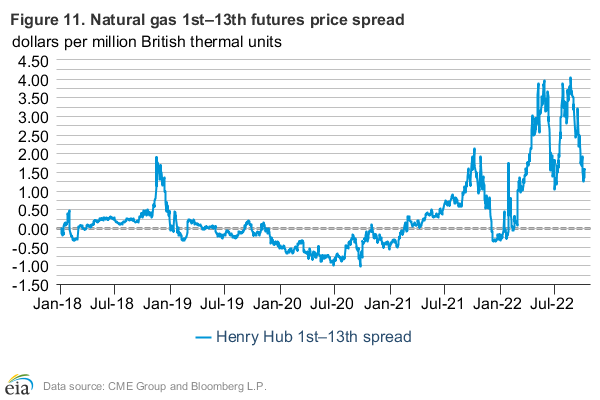
Backwardation (when near-term prices are greater than longer-term ones) in the Brent futures curve was relatively unchanged since May 1, close to its elevated levels after the May contract expired. The Brent 1st-13th month spread settled at $5.10/bbl on June 5, a slight decline of $0.62/bbl since May 1 (Figure 3). Expectations that OPEC spare production capacity will decline during the summer months are likely contributing to the relative strength in the near-term contracts.
With inventory withdrawals at Cushing, Oklahoma, picking up toward the end of May, backwardation in the WTI futures curve increased. The 1st-13th month contract spread settled at $9.39/bbl on June 5, $0.69/bbl higher compared to May 1. Commercial crude oil inventories at the WTI futures contract delivery point fell to 21.3 million barrels for the week ending May 30, their lowest point since November 2008.
Emerging market equities: China, India, and Brazil represent three of the largest non-OECD consumers of crude oil but their equity markets, which tend to shift with expectations for future economic growth, diverged since the start of the year. Adjusting for changes in currency values, Brazil and India’s equity markets are 8% and 26% higher, respectively, from the start of the year while China’s equity markets declined by 4% (Figure 4).
Trading Volume: The combined trading volume for Brent and WTI contracts through the first five months of the year is lower compared to the first five months of 2013, with reduced levels of price volatility likely a factor in the decline. From January through May, just over 54 million and 59 million WTI and Brent futures contracts were traded, respectively, representing a decline of over 10% in total trading volume from the same time in 2013 (Figure 5). If this trend continues, it will be only the second year-over-year decline in combined trading volume for these futures contracts since 2000.
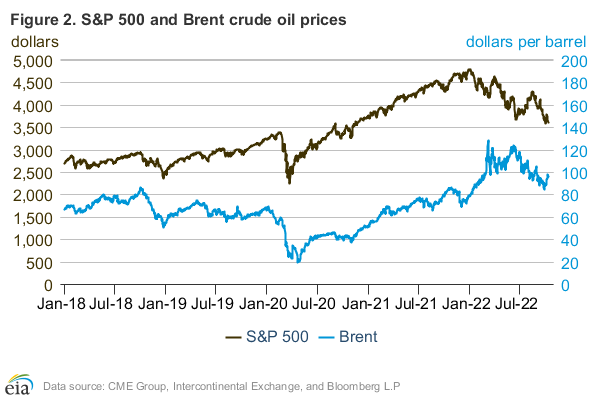
Volatility: The OVX index, which measures near-term implied volatility in the WTI futures market, settled at 15.1% on June 5, a decrease of 3.3 percentage points since May 1 (Figure 6). It’s the lowest level this year and reflects the general stability in oil prices over that time period. Low volatility is not limited just to oil markets, as the VIX, a measure of short-term implied volatility for the S&P 500, also decreased to its lowest point of the year in June.
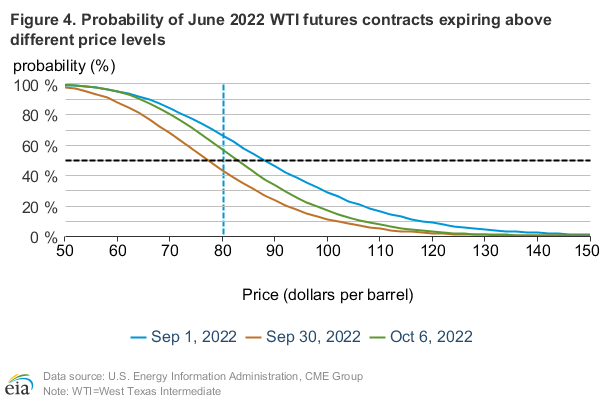
Market-Derived Probabilities: The September 2014 WTI futures contract averaged $100.99/bbl for the five trading days ending June 5 and has a probability of exceeding $100/bbl at expiration of 55%. The same contract for the five trading days ending May 1 had a probability of exceeding $100 of 39% (Figure 7). Because Brent prices are higher than WTI prices, the probability of Brent futures contracts expiring above the same dollar thresholds is higher.
Petroleum Products
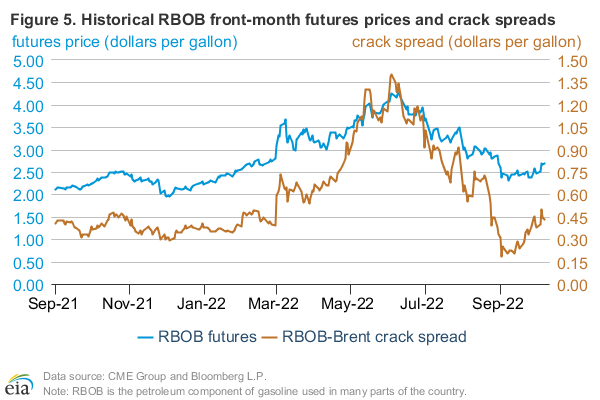
Gasoline prices: The reformulated blendstock for oxygenate blending (RBOB, the petroleum component of gasoline) front month futures price settled at $2.96 per gallon (gal) on June 5, $0.02/gal higher than its May 1 level (Figure 8). The RBOB-Brent crack spread declined slightly by $0.01/gal, settling at $0.37/gal on June 5.
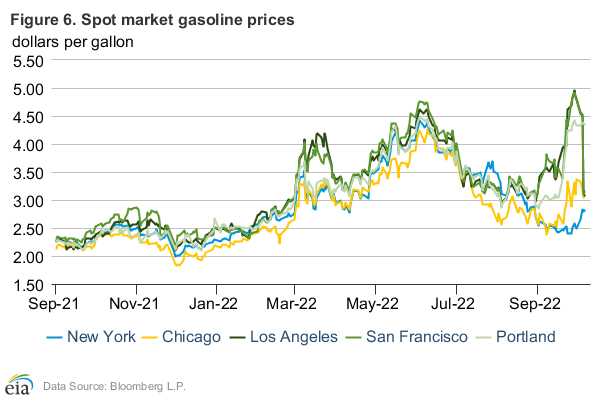
Gasoline prices showed some strength going into the Memorial Day weekend; however, the U.S. gasoline market was able to absorb the surge in domestic consumption and exports at the beginning of the summer driving season. Total U.S. gasoline consumption plus exports reached 9.6 million barrels per day (MMbbl/d) for the four weeks ending May 30, an increase of 0.4 MMbbl/d from April, which was the largest growth from April to May in the last 10 years. Despite this increase, the availability of gasoline, particularly in PADD 1, helped to keep gasoline prices in May lower than the average in April. PADD 1 total motor gasoline inventories were bolstered by increases in refinery production and by an influx of imports from the Atlantic Basin to reach a stock level of 60.6 million barrels at the end of May, 6.4 million barrels higher than in April.
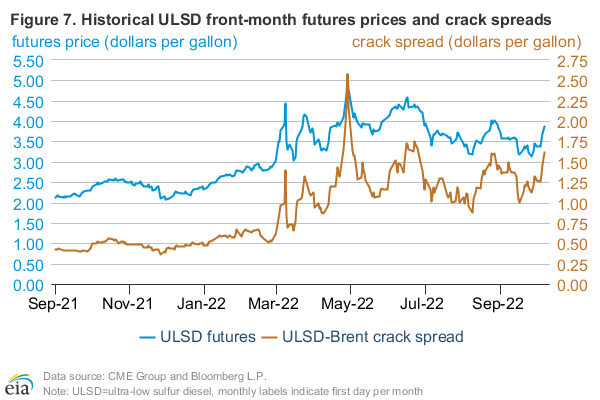
Heating Oil prices: The front month futures price for heating oil declined $0.03/gal from May 1, settling at $2.88/gal on June 5 (Figure 9). The heating oil-Brent crack spread settled at $0.29/gal on June 5, down $0.06/gal from the beginning of May. The heating oil-Brent crack spread reached its lowest point since the underlying commodity of the heating oil futures contract became ultralow sulfur diesel in May 2013.
Distillate consumption plus exports increased by 0.2 MMbbl/d from last May to reach 5.0 MMbbl/d, while distillate production plus imports rose by 0.2 MMbbl/d over the same period to 5.2 MMbbl/d. Although distillate stocks continue to remain below their respective 2013 levels, inventories have grown every month since February.
Refining earnings: First-quarter 2014 financial results continued a three-year trend of North American refineries showing considerably higher profitability than European refineries on an earnings per barrel processed basis (Figure 10). EIA compared 13 companies based in North America and 13 in Europe. Ten of these companies have nearly all their refinery throughput in North America, 10 others have nearly all their throughput in Europe, and 6 have refineries throughout the world. The North American group had earnings per barrel processed of $7.48/bbl in the first quarter, while the European group earned $0.97/bbl and the global group earned $3.34. Compared to refineries in other parts of the world, companies with North American refineries benefitted from lower crude oil prices relative to global prices, with the Brent-WTI spread averaging $9.26/bbl in the first quarter of 2014 (see Figure 2). Whereas U.S. crude oil prices are affected mostly by local supply and infrastructure dynamics, refined product prices continue to be driven by international crude oil prices and global product markets.
Volatility: Implied volatility for the front month RBOB contract and front month heating oil contract declined by 3.3 percentage points and 3.4 percentage points, respectively, from May 1 to settle at 13.9% and 11.9%, respectively, on June 5 (Figure 11). The implied volatility for both RBOB and heating oil front month contracts had a sharp, temporary one-day decline on May 23 due to low trading volumes for options on the June contract as expiration neared, similar to the drop that occurred at this time last year.
Market-Derived Probabilities: The September 2014 RBOB futures contract averaged $2.88/gal for the five trading days ending June 5 and has a probability of exceeding $2.85/gal (typically leading to a retail price of $3.50/gal) at expiration of approximately 54%. The same contract for the five trading days ending May 1 had a probability of 49% of exceeding $2.85/gal (Figure 12).
Natural Gas
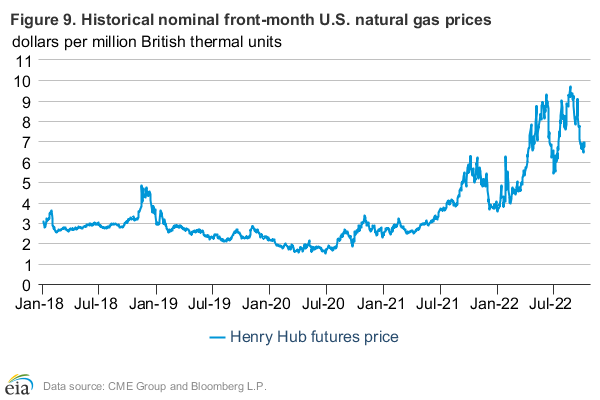
Prices: Henry Hub futures prices decreased throughout the first half of May. After reaching a bottom of $4.36/MMBtu on May 13, futures prices climbed to $4.70/MMBtu on June 5, $0.02/MMBtu lower than the price on May 1 (Figure 13). Weekly storage injections since May 10 were greater than weekly injections in the corresponding period of the last three years.
Warmer-than-normal weather persisted for most of May 2014 (Figure 14), with cooling degree days for the month 23% higher than the 30-year May average. Bentek Energy estimates that gas-fired power burn in May averaged 20.9 billion cubic feet per day (Bcf/d), a 0.8 Bcf/d increase over May 2013, even though natural gas front month futures prices were on average $0.47/MMBtu higher over that same timeframe.
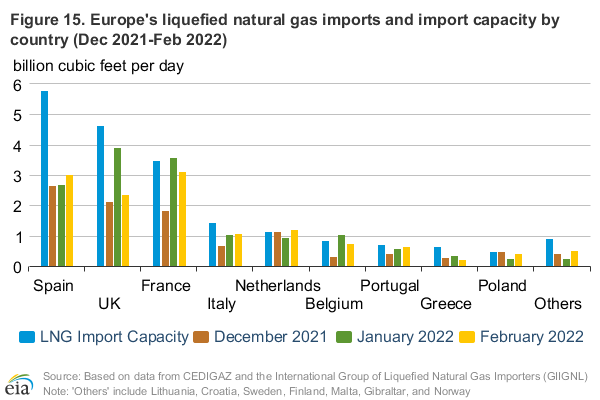
Continued increases in Marcellus production without corresponding increases in takeaway capacity have widened Appalachian spot price discounts relative to Henry Hub prices to the widest monthly average since data collection began, excluding February 2014’s price spikes because of much colder-than-normal temperatures (Figure 15). Tennessee Zone 4 and Transco Leidy hubs each averaged more than $2/MMBtu under Henry Hub spot prices in May. Production in the Marcellus increased 34% over last year. With Marcellus production rising, flows of gas from other producing regions into the Northeast have decreased, leading companies to express interest in reversing traditional flows or expanding takeaway capacity. Rockies Express Pipeline LLC (REX) recently held an open bidding season for expansion of east-to-west flows of 1.2 Bcf/d for 2015 operation, receiving firm commitments from producers. REX is also soliciting interest for further east-to-west movements for 2016-17 operation.
Volatility: Implied volatility decreased 1.3 percentage points since May 1, settling at 26.1% on June 5 (Figure 16). Implied volatility remained below historical volatility throughout most of May. Before the winter’s volatility spike, this condition only held for a sustained period of time during the withdrawal season of 2012-13 and May of 2013. Implied volatility touched a 10-year low of 19.34% on May 23 as option contracts neared expiration.
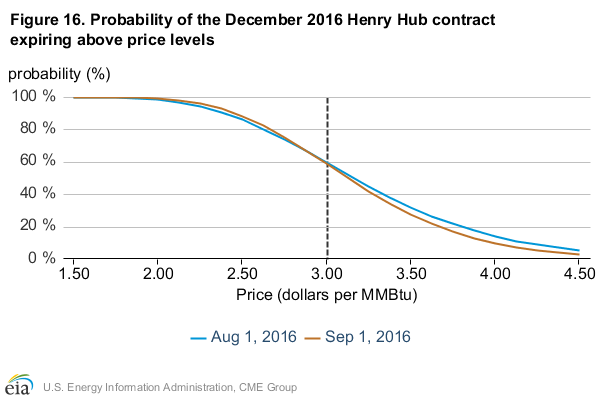
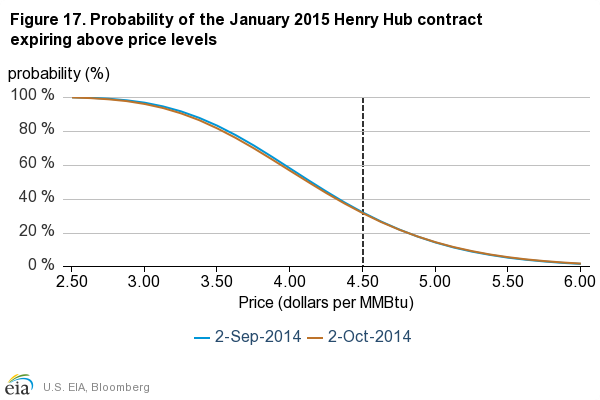
Market-Derived Probabilities: The September 2014 Henry Hub futures contract averaged $4.58/MMBtu for the five trading days ending June 5 and has a probability of exceeding $4.50/MMBtu at expiration of approximately 53%. The same contract for the five trading days ending May 1 had a probability of 60% of exceeding $4.50/MMBtu (Figure 17).