Crude Oil Steps Into the Spotlight
- OPEC+ unwinds another major portion of voluntary cuts
- Trump Administration ratcheting up pressure on India
- Indian refiners adjust some crude oil purchasing
- Data center electricity demand expected to cluster near natural gas resources
Sincerely,
David Thompson, CMT
Executive Vice President
Powerhouse
(202) 333-5380
The Matrix
OPEC+ increased their oil output quotas by another 547,000 barrels per day (bpd) at a virtual meeting on Sunday. Since April, the cartel has now brought back 2.466 million bpd of production including a separate, additional boost for the United Arab Emirates. While OPEC leaders must be pleased that they have reversed the largest of their voluntary production curtailments without crashing the price of oil, another major inflection point is close at hand.
Friday, August 8, is the current Trump-imposed deadline for Russia to make some sort of progress towards peace in the Ukraine conflict. As previously discussed here, the President has told India and China they will face higher tariffs if they continue to buy Russian oil, the so-called secondary sanctions. India currently buys approximately 1.7 million bpd or Russian crude oil although this number varies from month to month.
While the Indian government has not announced any official change to their sourcing strategy, three major Indian refining companies did not seek to buy Russian crude oil last week and Indian Oil Corp (IOC), the country’s largest refiner, announced that it has purchased 4.5 million barrels of U.S. crude oil. At present, these moves do not appear sufficient to dissuade the imposition of higher tariffs according to the President’s recent social media posts. China is voicing a harder line in response to the secondary tariff threat, with their Foreign Ministry recently stating that, “coercion won’t achieve anything”.
Even with OPEC+’s most recent announcement, the group is still voluntarily withholding another 2 million bpd of production. These barrels could prove critical if the Administration does successfully pressure India to turn away from Russian oil purchases.
Supply/Demand Balances
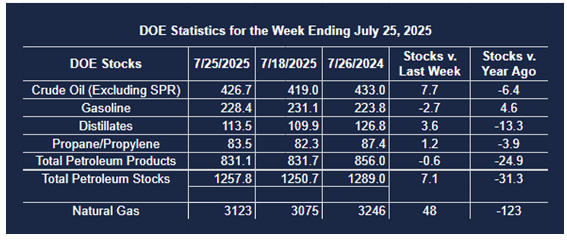
Supply/demand data in the United States for the week ended July 25, 2025, were released by the Energy Information Administration.
Total commercial stocks of petroleum increased (⬆) 7.1 million barrels to 1.2578 billion barrels during the week ended July 25th, 2025.
Commercial crude oil supplies in the United States were higher (⬆) by 7.7 million barrels from the previous report week to 426.7 million barrels.
Crude oil inventory changes by PAD District:
- PADD 1: Down (⬇) 0.4 million barrels to 8.3 million barrels
- PADD 2: Up (⬆) 0.9 million barrels to 102.7 million barrels
- PADD 3: Up (⬆) 6.0 million barrels to 243.8 million barrels
- PADD 4: Unchanged (=) at 23.1 million barrels
- PADD 5: Up (⬆) 1.2 million barrels to 47.9 million barrels
Cushing, Oklahoma, inventories were up (⬆) 0.7 million barrels to 22.6 million barrels.
Domestic crude oil production increased (⬆) 41,000 barrels per day from the previous report at 13.314 million barrels per day.
Crude oil imports averaged 6.136 million barrels per day, a daily increase (⬆) of 159,000 barrels. Exports decreased (⬇) 1,157,000 barrels daily to 2.698 million barrels per day.
Refineries used 95.4% of capacity; a decrease (⬇) of 0.1% from the previous report week.
Crude oil inputs to refineries decreased (⬇) 25,000 barrels daily; there were 16.911 million barrels per day of crude oil run to facilities. Gross inputs, which include blending stocks, decreased (⬇) 11,000 barrels daily to 17.261 million barrels daily.
Total petroleum product inventories decreased (⬇) by 0.7 million barrels from the previous report week, down to 831.1 million barrels.
Total product demand decreased (⬇) 383,000 barrels daily to 21.387 million barrels per day.
Gasoline stocks decreased (⬇) 2.7 million barrels from the previous report week; total stocks are 228.4 million barrels.
Demand for gasoline increased (⬆) 185,000 barrels per day to 9.152 million barrels per day.
Distillate fuel oil stocks increased (⬆) 3.6 million barrels from the previous report week; distillate stocks are at 113.5 million barrels. EIA reported national distillate demand at 3.605 million barrels per day during the report week, a increase (⬆) of 262,000 barrels daily.
Propane stocks rose (⬆) 1.1 million barrels from the previous report to 83.5 million barrels. The report estimated current demand at 1,089,000 barrels per day, an increase (⬆) of 146,000 barrels daily from the previous report week.
Natural Gas
The most recent Short-Term Energy Outlook from the EIA provides an eye-catching graphical representation of the expected changes in electricity demand.
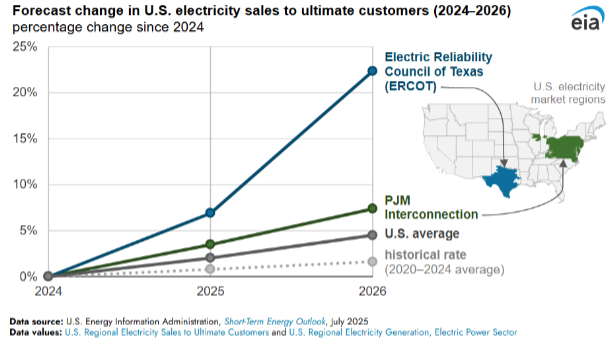
From 2005 – 2020, U.S. electricity demand grew but at a relatively modest pace. EIA expects a 14% jump in electricity demand in ERCOT and a 4% jump in PJM by the end of 2026. The demand growth, fueled by data centers (and population growth in Texas) is unsurprisingly concentrated in the two regions that are home to massive natural gas reserves.
According to the EIA:
Net injections into storage totaled 48 Bcf for the week ended July 25, compared with the five-year (2020–24) average net injections of 24 Bcf and last year’s net injections of 18 Bcf during the same week. Working natural gas stocks totaled 3,123 Bcf, which is 195 Bcf (7%) more than the five-year average and 123 Bcf (4%) lower than last year at this time.
According to The Desk survey of natural gas analysts, estimates of the weekly net change to working natural gas stocks ranged from net injections of 31 Bcf to 58 Bcf, with a median estimate of 39 Bcf.
The average rate of injections into storage is 24% higher than the five-year average so far in the refill season (April through October). If the rate of injections into storage matched the five-year average of 8.4 Bcf/d for the remainder of the refill season, the total inventory would be 3,948 Bcf on October 31, which is 195 Bcf higher than the five-year average of 3,753 Bcf for that time of year.
Was this helpful? We’d like your feedback.
Please respond to [email protected]
This material has been prepared by a sales or trading employee or agent of Powerhouse Brokers, LLC and is, or is in the nature of, a solicitation. This material is not a research report prepared by Powerhouse Brokers, LLC. By accepting this communication, you agree that you are an experienced user of the futures markets, capable of making independent trading decisions, and agree that you are not, and will not, rely solely on this communication in making trading decisions.
DISTRIBUTION IN SOME JURISDICTIONS MAY BE PROHIBITED OR RESTRICTED BY LAW. PERSONS IN POSSESSION OF THIS COMMUNICATION INDIRECTLY SHOULD INFORM THEMSELVES ABOUT AND OBSERVE ANY SUCH PROHIBITION OR RESTRICTIONS. TO THE EXTENT THAT YOU HAVE RECEIVED THIS COMMUNICATION INDIRECTLY AND SOLICITATIONS ARE PROHIBITED IN YOUR JURISDICTION WITHOUT REGISTRATION, THE MARKET COMMENTARY IN THIS COMMUNICATION SHOULD NOT BE CONSIDERED A SOLICITATION.
The risk of loss in trading futures and/or options is substantial and each investor and/or trader must consider whether this is a suitable investment. Past performance, whether actual or indicated by simulated historical tests of strategies, is not indicative of future results. Trading advice is based on information taken from trades and statistical services and other sources that Powerhouse Brokers, LLC believes are reliable. We do not guarantee that such information is accurate or complete and it should not be relied upon as such. Trading advice reflects our good faith judgment at a specific time and is subject to change without notice. There is no guarantee that the advice we give will result in profitable trades.
Copyright 2025 Powerhouse Brokers, LLC, All rights reserved