Returning the Focus to Fundamentals
- Geopolitical risk premium now exiting the market
- Baker-Hughes rig count continues to fall
- U.S. refiners’ demand for crude remains strong
- Significant new chapter begins for the Canadian energy sector
Sincerely,
David Thompson, CMT
Executive Vice President
Powerhouse
(202) 333-5380
The Matrix
The news market is oversupplied with opinions about what might happen next in the conflict with Iran. As the weekend’s events demonstrated, the number of people who actually know what actions will occur can probably be counted on one hand (with fingers to spare). This edition of the Weekly Energy Market Situation focuses things that the rest of us can count.
Prior to Israel’s initial strikes on Iran, the global energy market had been focused on the economic effects of the US tariff dispute and the consensus view that the amount of oil being brought to the market by both OPEC+ and non-OPEC would increase over the second half of 2025.
At present, the additional quota increases that OPEC+ has granted themselves have not yet fully materialized into more barrels into the market. The cartel may in fact pump more oil in the next few months, but it is interesting to note the U.S. rig count has now declined for eight consecutive weeks. This comes despite President Trump’s admonition today to, “Drill and I mean now”.
Healthy crack spreads continue to support refiners’ demand for crude oil. U.S. refiners are running at rates close to the top of the 5-year range.

Moderating supply taken in conjunction with high levels of refinery throughput have driven crude oil days of supply below the low of the current five year range.
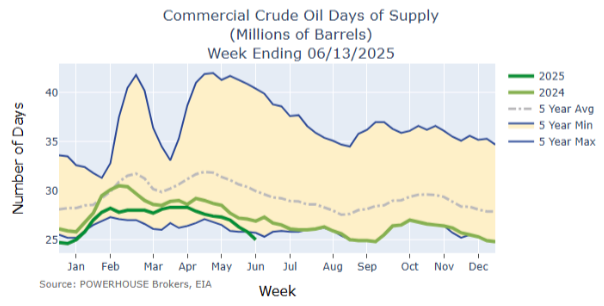
The U.S. military engagement and the lack of an immediate Iranian response aimed at energy targets is currently removing the fear premium in the price of oil. However, market participants should not lose sight of crude oil supply and demand. The seeds of the next energy bull market might well be found in this data. Unlike geopolitics, these are fundamentals that we can measure and evaluate on a weekly basis.
Supply/Demand Balances
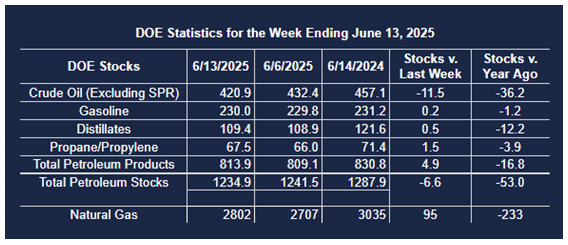
Supply/demand data in the United States for the week ended June 13, 2025, were released by the Energy Information Administration.
Total commercial stocks of petroleum decreased (⬇) 6.6 million barrels to 1.2349 billion barrels during the week ended June 13th, 2025.
Commercial crude oil supplies in the United States were lower (⬇) by 11.5 million barrels from the previous report week to 420.3 million barrels.
Crude oil inventory changes by PAD District:
PADD 1: Down (⬇) 0.2 million barrels to 9.3 million barrels
PADD 2: Down (⬇) 2.5 million barrels to 102.9 million barrels
PADD 3: Down (⬇) 7.7 million barrels to 234.9 million barrels
PADD 4: Down (⬇) 0.8 million barrels to 23.8 million barrels
PADD 5: Down (⬇) 0.2 million barrels to 50.1 million barrels
Cushing, Oklahoma, inventories were down (⬇) 1.0 million barrels to 22.7 million barrels.
Domestic crude oil production increased (⬆) 3,000 barrels per day from the previous report at 13.431 million barrels per day.
Crude oil imports averaged 5.504 million barrels per day, a daily decrease (⬇) of 672,000 barrels. Exports increased (⬆) 1,075,000 barrels daily to 4.361 million barrels per day.
Refineries used 93.2% of capacity; a decrease (⬇) of 1.1% from the previous report week.
Crude oil inputs to refineries decreased (⬇) 364,000 barrels daily; there were 16.862 million barrels per day of crude oil run to facilities. Gross inputs, which include blending stocks, decreased (⬇) 217,000 barrels daily to 17.147 million barrels daily.
Total petroleum product inventories increased (⬆) by 4.9 million barrels from the previous report week, up to 814.0 million barrels.
Total product demand increased (⬆) 629,000 barrels daily to 20.391 million barrels per day.
Gasoline stocks increased (⬆) 0.2 million barrels from the previous report week; total stocks are 230.0 million barrels.
Demand for gasoline increased (⬆) 130,000 barrels per day to 9.299 million barrels per day.
Distillate fuel oil stocks increased (⬆) 0.5 million barrels from the previous report week; distillate stocks are at 109.4 million barrels. EIA reported national distillate demand at 3.746 million barrels per day during the report week, an increase (⬆) of 370,000 barrels daily.
Propane stocks rose (⬆) 1.5 million barrels from the previous report to 67.5 million barrels. The report estimated current demand at 825,000 barrels per day, an increase (⬆) of 246,000 barrels daily from the previous report week.
Natural Gas
Canada has now produced its first LNG for export out of the Kitimat facility in British Columbia. The first LNG tanker is expected to start loading by the end of the month. The Kitimat plant will be able to export 14 million metric tonnes of LNG per year. Talks are already underway to double this capacity.
Because this new facility will give Canadian gas producers access to the Asian markets, exports to the U.S. are expected to decline.
According to the EIA:
- Net injections into storage totaled 109 Bcf for the week ended June 6, compared with the five-year (2020–24) average net injections of 87 Bcf and last year’s net injections of 77 Bcf during the same week. This weekly injection marks the seventh in a row above 100 Bcf, the longest streak since 2014. Working natural gas stocks totaled 2,707 Bcf, which is 139 Bcf (5%) more than the five-year average and 256 Bcf (9%) lower than last year at this time.
- According to The Desk survey of natural gas analysts, estimates of the weekly net change to working natural gas stocks ranged from net injections of 96 Bcf to 117 Bcf, with a median estimate of 106 Bcf.
- The average rate of injections into storage is 29% higher than the five-year average so far in the refill season (April through October). If the rate of injections into storage matched the five-year average of 8.1 Bcf/d for the remainder of the refill season, the total inventory would be 3,892 Bcf on October 31, which is 139 Bcf higher than the five-year average of 3,753 Bcf for that time of year.
Was this memo helpful? We’d like your feedback.
Please respond to [email protected]
This material has been prepared by a sales or trading employee or agent of Powerhouse Brokers, LLC and is, or is in the nature of, a solicitation. This material is not a research report prepared by Powerhouse Brokers, LLC. By accepting this communication, you agree that you are an experienced user of the futures markets, capable of making independent trading decisions, and agree that you are not, and will not, rely solely on this communication in making trading decisions.
DISTRIBUTION IN SOME JURISDICTIONS MAY BE PROHIBITED OR RESTRICTED BY LAW. PERSONS IN POSSESSION OF THIS COMMUNICATION INDIRECTLY SHOULD INFORM THEMSELVES ABOUT AND OBSERVE ANY SUCH PROHIBITION OR RESTRICTIONS. TO THE EXTENT THAT YOU HAVE RECEIVED THIS COMMUNICATION INDIRECTLY AND SOLICITATIONS ARE PROHIBITED IN YOUR JURISDICTION WITHOUT REGISTRATION, THE MARKET COMMENTARY IN THIS COMMUNICATION SHOULD NOT BE CONSIDERED A SOLICITATION.
The risk of loss in trading futures and/or options is substantial and each investor and/or trader must consider whether this is a suitable investment. Past performance, whether actual or indicated by simulated historical tests of strategies, is not indicative of future results. Trading advice is based on information taken from trades and statistical services and other sources that Powerhouse Brokers, LLC believes are reliable. We do not guarantee that such information is accurate or complete and it should not be relied upon as such. Trading advice reflects our good faith judgment at a specific time and is subject to change without notice. There is no guarantee that the advice we give will result in profitable trades.
Copyright 2025 Powerhouse Brokers, LLC, All rights reserved