The Great Game Revisited
- Lower energy prices a critical goal for Trump Administration
- U.S. producers & OPEC not guaranteed to increase output
- Pressure may be growing for a Russia/Ukraine/Iran deal
- Muted impact from tariffs on US LNG exports
Sincerely,
David Thompson, CMT
Executive Vice President
Powerhouse
(202) 333-5380
The Matrix
Now that the Big Game in New Orleans is over, our focus can return to a longer-running contest that also commands a global audience. In the late 1800’s, the geopolitical rivalry between the West (led by Great Britain at the time) and Russia was referred to as ‘the Great Game’. Some of the players have changed – the United States has subbed in for Britain. Some of the names have changed, Persia is now Iran. Russia became the U.S.S.R. and then reverted to Russia. But the Game continues.
Now, as then, the Game focuses on spheres of influence and global commerce, specifically energy. President Trump has made numerous public comments indicating his desire to see lower energy prices, “We’re going to drive down the price of oil, and everything else will follow” (February 6, 2025). The political benefits of such an outcome are obvious. But a path to achieving this goal is byzantine.
The Administration has indicated that it will ease regulatory hurdles to increasing U.S. oil production. This alone may not be enough incentive for U.S. producers to put more rigs into service. The CEO of Diamondback Energy, one of the leading drillers in the Permian, said
“Companies are no longer pursuing growth at all costs. Shale is in a much different phase of its life cycle.”
Trump has suggested Saudi Arabia increase its production, yet the International Monetary Fund estimates that the Saudis need oil at $90 per barrel this year to balance its budget. And even if the Saudis were to increase output, this might only serve as an offset to Iranian barrels driven off the market by the return to the ‘maximum pressure’ sanctions regime.
A grand political deal involving Russia/Ukraine and Iran might enable more Russian and Iranian supply to reach the market while removing the current risk premium. Clearly this would be an extraordinarily difficult deal to achieve. But given the Administration’s intense focus on lowering prices for the American consumer, it should not be dismissed out of hand.
Supply/Demand Balances
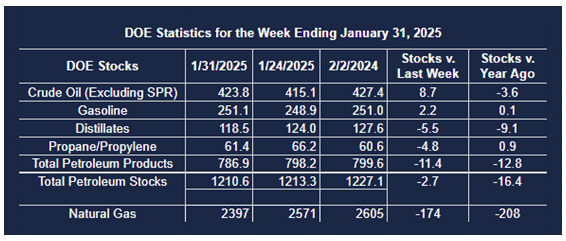
Supply/demand data in the United States for the week ended January 31, 2025, were released by the Energy Information Administration.
Total commercial stocks of petroleum decreased (⬇) 2.7 million barrels to 1.2106 billion barrels during the week ended January 31st, 2025.
Commercial crude oil supplies in the United States were higher (⬆) by 8.7 million barrels from the previous report week to 423.8 million barrels.
Crude oil inventory changes by PAD District:
PADD 1: Up (⬆) 1.4 million barrels to 1.4 million barrels
PADD 2: Up (⬆) 0.2 million barrels to 103.0 million barrels
PADD 3: Up (⬆) 6.6 million barrels to 239.0 million barrels
PADD 4: Up (⬆) 0.5 million barrels to 24.4 million barrels
PADD 5: Up (⬆) 0.1 million barrels to 49.0 million barrels
Cushing, Oklahoma, inventories were down (⬇) 0.1 million barrels to 20.9 million barrels.
Domestic crude oil production increased (⬆) 238,000 barrels per day from the previous report at 13.478 million barrels per day.
Crude oil imports averaged 6.915 million barrels per day, a daily increase (⬆) of 467,000 barrels. Exports increased (⬆) 645,000 barrels daily to 4.331 million barrels per day.
Refineries used 81.5% of capacity; an increase (⬆) of 1.0% from the previous report week.
Crude oil inputs to refineries increased (⬆) 159,000 barrels daily; there were 15.349 million barrels per day of crude oil run to facilities. Gross inputs, which include blending stocks, increased (⬆) 193,000 barrels daily to 15.511 million barrels daily.
Total petroleum product inventories decreased (⬇) by 11.5 million barrels from the previous report week, up to 786.8 million barrels.
Total product demand decreased (⬇) 12,000 barrels daily to 21.075 million barrels per day.
Gasoline stocks increased (⬆) 2.2 million barrels from the previous report week; total stocks are 251.1 million barrels.
Demand for gasoline increased (⬆) 25,000 barrels per day to 8.328 million barrels per day.
Distillate fuel oil stocks decreased (⬇) 5.5 million barrels from the previous report week; distillate stocks are at 118.5 million barrels. EIA reported national distillate demand at 4.599 million barrels per day during the report week, an increase (⬆) of 93,000 barrels daily.
Propane stocks fell (⬇) 4.8 million barrels from the previous report to 61.4 million barrels. The report estimated current demand at 1,296,000 barrels per day, a decrease (⬇) of 682,000 barrels daily from the previous report week.
Natural Gas
The global natural gas market is currently being driven more by supply and weather-driven demand than by political pronouncements. Less supply into Europe combined with colder weather has pushed prices in the EU up by 15% so far this year.
The 15% counter tariffs imposed by China on the import of LNG from the U.S. are unlikely to have a significant impact. In January ’25 only 2% of U.S. LNG exports went to China. The Chinese effectively stopped buying U.S. LNG because of the trade disputes during the previous Trump Administration.
Rumors of a Ukrainian/Russian ceasefire caused a temporary sell-off the in the stock prices of LNG export companies. While a settlement to the conflict has the potential to remove sanctions on Russian gas, it is unclear if European buyers would quickly rush to re-engage with Russia. Currently, Europe pulls in 33% of the world’s LNG which is up from 25% in 2024.
According to the EIA:
- Net withdrawals from storage totaled 174 Bcf for the week ended January 31, compared with the five-year (2020–24) average net withdrawals of 174 Bcf and last year’s net withdrawals of 110 Bcf during the same week. Working natural gas stocks totaled 2,397 Bcf, which is 111 Bcf (4%) lower than the five-year average and 208 Bcf (8%) lower than last year at this time.
- According to The Desk survey of natural gas analysts, estimates of the weekly net change to working natural gas stocks ranged from net withdrawals of 144 Bcf to 189 Bcf, with a median estimate of 169 Bcf.
- The average rate of withdrawals from storage is 27% higher than the five-year average so far in the withdrawal season (November through March). If the rate of withdrawals from storage matched the five-year average of 11.0 Bcf/d for the remainder of the withdrawal season, the total inventory would be 1,749 Bcf on March 31, which is 111 Bcf lower than the five-year average of 1,860 Bcf for that time of year.
Was this helpful? We’d like your feedback.
Please respond to [email protected]
This material has been prepared by a sales or trading employee or agent of Powerhouse Brokers, LLC and is, or is in the nature of, a solicitation. This material is not a research report prepared by Powerhouse Brokers, LLC. By accepting this communication, you agree that you are an experienced user of the futures markets, capable of making independent trading decisions, and agree that you are not, and will not, rely solely on this communication in making trading decisions.
DISTRIBUTION IN SOME JURISDICTIONS MAY BE PROHIBITED OR RESTRICTED BY LAW. PERSONS IN POSSESSION OF THIS COMMUNICATION INDIRECTLY SHOULD INFORM THEMSELVES ABOUT AND OBSERVE ANY SUCH PROHIBITION OR RESTRICTIONS. TO THE EXTENT THAT YOU HAVE RECEIVED THIS COMMUNICATION INDIRECTLY AND SOLICITATIONS ARE PROHIBITED IN YOUR JURISDICTION WITHOUT REGISTRATION, THE MARKET COMMENTARY IN THIS COMMUNICATION SHOULD NOT BE CONSIDERED A SOLICITATION.
The risk of loss in trading futures and/or options is substantial and each investor and/or trader must consider whether this is a suitable investment. Past performance, whether actual or indicated by simulated historical tests of strategies, is not indicative of future results. Trading advice is based on information taken from trades and statistical services and other sources that Powerhouse Brokers, LLC believes are reliable. We do not guarantee that such information is accurate or complete and it should not be relied upon as such. Trading advice reflects our good faith judgment at a specific time and is subject to change without notice. There is no guarantee that the advice we give will result in profitable trades.
Copyright 2025 Powerhouse Brokers, LLC, All rights reserved