Assessing the Impact of AI on Energy Markets
- The rapidly developing AI sector has been a major boost for energy demand forecasts
- New models from China appear to dramatically lower costs
- The growth rate of US data center construction may be somewhat shielded from DeepSeek
- LNG not AI is the near-term driver for natural gas demand
Sincerely,
David Thompson, CMT
Executive Vice President
Powerhouse
(202) 333-5380
The Matrix
One of the hottest emerging trends in US energy markets is new demand for natural gas and diesel to power and support artificial intelligence (AI) data centers. In terms of petroleum, jobbers in various regions around the country have previously reported an uptick in demand for diesel to supply back-up power generation at AI data centers.
Global markets were rattled by the news that Chinese AI company DeepSeek has developed a model that performs on a par with those made by US firms despite lower costs and consuming less energy. While tech investors worry about stock price valuations, energy marketers are assessing what effect this development may have on diesel and natural gas demand.
Data centers are not all the same. The DeepSeek model reportedly cuts the cost of what is known in the industry as AI Training. Other data centers are focused on what is called AI Inference. Some bank analysts believe that the majority of US data center growth in the next several years will focus on AI Inference. DeepSeek’s new model may also lower the overall ‘cost of compute’ and lead to a more rapid commercial adoption of AI. Energy demand from greater adoption may offset any demand loss from improved efficiency.
The limit on diesel demand growth in the AI sector may not come from the software but from hardware. Not computers themselves, but rather large diesel generators. Leading US diesel engine manufacturers have a backlog of orders out to 2027. While more generators will be going into service in the coming years, there is currently a limit on how many of those units can get into the field.
Supply/Demand Balances
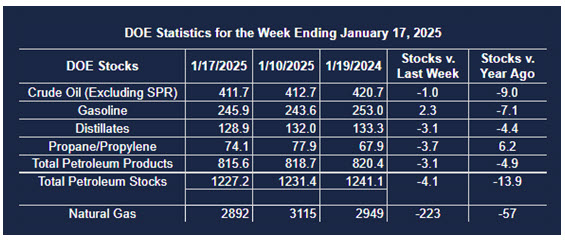
Supply/demand data in the United States for the week ended January 17, 2025, were released by the Energy Information Administration.
Total commercial stocks of petroleum decreased (⬇) 4.1 million barrels to 1.2272 billion barrels during the week ended January 17th, 2025.
Commercial crude oil supplies in the United States were lower (⬇) by 1.0 million barrels from the previous report week to 411.7 million barrels.
Crude oil inventory changes by PAD District:
PADD 1: Up (⬆) 0.6 million barrels to 7.8 million barrels
PADD 2: Up (⬆) 0.3 million barrels to 102.6 million barrels
PADD 3: Down (⬇) 2.1 million barrels to 228.2 million barrels
PADD 4: Unchanged (=) at 24.5 million barrels
PADD 5: Up (⬆) 0.2 million barrels to 48.6 million barrels
Cushing, Oklahoma, inventories were down (⬇) 0.1 million barrels to 20.7 million barrels.
Domestic crude oil production decreased (⬇) 4,000 barrels per day from the previous report at 13.477 million barrels per day.
Crude oil imports averaged 6.745 million barrels per day, a daily increase (⬆) of 621,000 barrels. Exports increased (⬆) 437,000 barrels daily to 4.515 million barrels per day.
Refineries used 85.9 percent of capacity; a decrease (⬇) of 5.8 percent from the previous report week.
Crude oil inputs to refineries decreased (⬇) 1,125,000 barrels daily; there were 15.522 million barrels per day of crude oil run to facilities. Gross inputs, which include blending stocks, decreased (⬇) 1,054,000 barrels daily to 15.762 million barrels daily.
Total petroleum product inventories decreased (⬇) by 3.1 million barrels from the previous report week, up to 815.6 million barrels.
Total product demand decreased (⬇) 1,597,000 barrels daily to 19.597 million barrels per day.
Gasoline stocks increased (⬆) 2.3 million barrels from the previous report week; total stocks are 245.9 million barrels.
Demand for gasoline decreased (⬇) 239,000 barrels per day to 8.086 million barrels per day.
Distillate fuel oil stocks decreased (⬇) 3.1 million barrels from the previous report week; distillate stocks are at 128.9 million barrels. EIA reported national distillate demand at 4.108 million barrels per day during the report week, an increase (⬆) of 269,000 barrels daily.
Propane stocks fell (⬇) 3.7 million barrels from the previous report to 74.1 million barrels. The report estimated current demand at 1,577,000 barrels per day, a decrease (⬇) of 20,000 barrels daily from the previous report week.
Natural Gas
Natural gas showed a large, bearish price response to the DeepSeek news. Analysts are scrambling to determine whether their demand forecast models remain valid. It is critical to remember that while increasing demand for power is a source of longer-term demand growth, LNG demand is a far more important consideration in the near-term. As last week’s Weekly Energy Market Situation reported, US LNG export capacity is set to increase by nearly 85% over the next four years.
Of greater near-term concern for natural gas market participants is the fact that the charts for both the February ’25 and March ’25 contracts show significant technical damage. A close below $3.05 basis the March natural gas futures contract would dissolve the uptrend that started on November 4, 2024.
According to the EIA:
- Net withdrawals from storage totaled 223 Bcf for the week ended January 17, compared with the five-year (2020–24) average net withdrawals of 167 Bcf and last year’s net withdrawals of 277 Bcf during the same week. Working natural gas stocks totaled 2,892 Bcf, which is 21 Bcf (1%) more than the five-year average and 57 Bcf (2%) lower than last year at this time.
- According to The Desk survey of natural gas analysts, estimates of the weekly net change to working natural gas stocks ranged from net withdrawals of 230 Bcf to 260 Bcf, with a median estimate of 244 Bcf.
- The average rate of withdrawals from storage is 22% higher than the five-year average so far in the withdrawal season (November through March). If the rate of withdrawals from storage matched the five-year average of 13.8 Bcf/d for the remainder of the withdrawal season, the total inventory would be 1,881 Bcf on March 31, which is 21 Bcf higher than the five-year average of 1,860 Bcf for that time of year.
Was this helpful? We’d like your feedback.
Please respond to [email protected]
This material has been prepared by a sales or trading employee or agent of Powerhouse Brokers, LLC and is, or is in the nature of, a solicitation. This material is not a research report prepared by Powerhouse Brokers, LLC. By accepting this communication, you agree that you are an experienced user of the futures markets, capable of making independent trading decisions, and agree that you are not, and will not, rely solely on this communication in making trading decisions.
DISTRIBUTION IN SOME JURISDICTIONS MAY BE PROHIBITED OR RESTRICTED BY LAW. PERSONS IN POSSESSION OF THIS COMMUNICATION INDIRECTLY SHOULD INFORM THEMSELVES ABOUT AND OBSERVE ANY SUCH PROHIBITION OR RESTRICTIONS. TO THE EXTENT THAT YOU HAVE RECEIVED THIS COMMUNICATION INDIRECTLY AND SOLICITATIONS ARE PROHIBITED IN YOUR JURISDICTION WITHOUT REGISTRATION, THE MARKET COMMENTARY IN THIS COMMUNICATION SHOULD NOT BE CONSIDERED A SOLICITATION.
The risk of loss in trading futures and/or options is substantial and each investor and/or trader must consider whether this is a suitable investment. Past performance, whether actual or indicated by simulated historical tests of strategies, is not indicative of future results. Trading advice is based on information taken from trades and statistical services and other sources that Powerhouse Brokers, LLC believes are reliable. We do not guarantee that such information is accurate or complete and it should not be relied upon as such. Trading advice reflects our good faith judgment at a specific time and is subject to change without notice. There is no guarantee that the advice we give will result in profitable trades.
Copyright 2025 Powerhouse Brokers, LLC, All rights reserved