To Everything There’s a Season
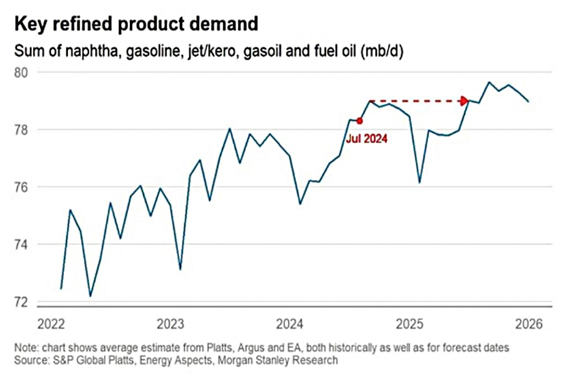
- On the cusp of seasonal changes in refined products demand
- Monitor refiners’ reaction
- Price volatility creates marketing opportunity
- Natural gas demand forecast to change
Sincerely
David Thompson, CMT
Executive Vice President
Powerhouse
(202) 333-5380
The Matrix
As the noise and excitement of Fourth of July fireworks has faded from memory so has the bullishness in gasoline futures prices. The 14.25% rally (intraday low to high on the front-month RBOB contract) that started in early June fizzled right after the Nation’s birthday celebration. This is in keeping with the typical seasonal pattern. Some bank analysts assess that refined product demand may be nearing a high watermark that won’t be seen again until mid-2025.
Refiners remain vigilant to this seasonal dynamic and are expected to reduce refinery throughput to protect their crack spread profit margins according to a survey of market watchers. The timing and interplay of these two trends will be a significant part of what drives refined products prices of the upcoming months.

POWERHOUSE will be closely watching demand levels, refinery throughput statistics and the crack spreads. If low cracks spread values persist in the face of falling demand, then cuts in refinery run rates might be justified on economic reasons.
Seasonal turning points offer an opportunity to commercial fuel marketers. Customers are often uncertain. Will the current trend persist for a while longer? Have they missed their window? While price is always a concern for fuel buyers, at an inflection point, ‘fear of missing out’ also starts to play a major role in customers’ thinking. An option strategy can often open the customer’s eyes to a new way to address their challenges. Marketers who can present these strategies can set themselves apart from their competition.
Supply/Demand Balances
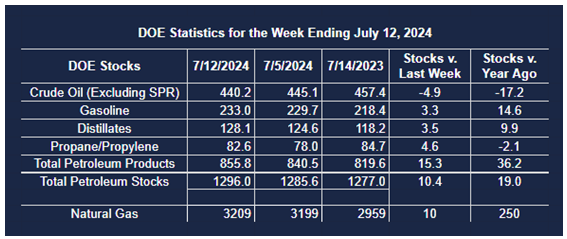
Supply/demand data in the United States for the week ended July 12, 2024, were released by the Energy Information Administration.
Total commercial stocks of petroleum increased (⬆) 10.4 million barrels to 1.296 billion barrels during the week ended July 12th, 2024.
Commercial crude oil supplies in the United States were lower (⬇) by 4.9 million barrels from the previous report week to 440.2 million barrels.
Crude oil inventory changes by PAD District:
PADD 1: Unchanged (=) at 8.4 million barrels
PADD 2: Down (⬇) 2.4 million barrels to 113.5 million barrels
PADD 3: Down (⬇) 3 million barrels to 248.5 million barrels
PADD 4: Down (⬇) 0.8 million barrels to 22.4 million barrels
PADD 5: Up (⬆) 1.3 million barrels to 47.4 million barrels
Cushing, Oklahoma, inventories were down (⬇) 0.8 million barrels to 32.7 million barrels.
Domestic crude oil production was unchanged (=) at 13.3 million barrels per day.
Crude oil imports averaged 7.037 million barrels per day, a daily increase (⬆) of 277,000 barrels. Exports decreased (⬇) 35,000 barrels daily to 3.964 million barrels per day.
Refineries used 93.7# of capacity; 1.7 percentage points less (⬇) than the previous report week.
Crude oil inputs to refineries decreased (⬇) 181,000 barrels daily; there were 16.928 million barrels per day of crude oil run to facilities. Gross inputs, which include blending stocks, decreased (⬇) 312,000 barrels daily to 17.175 million barrels daily.
Total petroleum product inventories increased (⬆) by 15.4 million barrels from the previous report week, up to 855.9 million barrels.
Total product demand decreased (⬇) 1,319,000 barrels daily to 19.430 million barrels per day.
Gasoline stocks increased (⬆) 3.3 million barrels from the previous report week; total stocks are 233 million barrels.
Demand for gasoline decreased (⬇) 615,000 barrels per day to 8.783 million barrels per day.
Distillate fuel oil stocks increased (⬆) 3.5 million barrels from the previous report week; distillate stocks are at 128.1 million barrels. EIA reported national distillate demand at 3.585 million barrels per day during the report week, an increase (⬆) of 119,000 barrels daily.
Propane stocks rose (⬆) 4.6 million barrels from the previous report to 82.6 million barrels. The report estimated current demand at 543,000 barrels per day, an decrease (⬇) of 324,000 barrels daily from the previous report week.
Natural Gas
The impact on power/natural gas demand from the rise of data centers dedicated to serving the needs of Artificial Intelligence ( AI ) computing is becoming better understood by the market. However, even experts in the natural gas industry have been surprised by the scale. Morgan Stanley analysts covering Kinder Morgan spoke to company Chair Richard Kinder. Kinder believes that the expected demand growth in electricity demand will be “jaw dropping”. He cited industry forecasts that expected annual electricity demand growth will be between 2.6 – 4.7% between now and 2030. Electricity demand growth over the past 20 years has averaged approximately 0.5% per year.
Those who closely watch the natural gas market know that long periods of subdued pricing can change rapidly and dramatically. End-users of natural gas may wish to consider some relatively inexpensive protection against higher prices in the future. Call spread strategies can provide attractive zones of price protection at costs less than outright call options. Reach out to POWERHOUSE to discuss in greater detail if appropriate.
According to the EIA:
- Net injections into storage totaled 10 Bcf for the week ended July 12, compared with the five-year (2019–2023) average net injections of 49 Bcf and last year’s net injections of 43 Bcf during the same week. Working natural gas stocks totaled 3,209 Bcf, which is 465 Bcf (17%) more than the five-year average and 250 Bcf (8%) more than last year at this time.
- According to The Desk survey of natural gas analysts, estimates of the weekly net change to working natural gas stocks ranged from net injections of 2 Bcf to 34 Bcf, with a median estimate of 22 Bcf.
The average rate of injections into storage is 15% lower than the five-year average so far in the refill season (April through October). If the rate of injections into storage matched the five-year average of 8.7 Bcf/d for the remainder of the refill season, the total inventory would be 4,177 Bcf on October 31, which is 465 Bcf higher than the five-year average of 3,712 Bcf for that time of year.
Was this helpful? We’d like your feedback.
Please respond to [email protected]
This material has been prepared by a sales or trading employee or agent of Powerhouse Brokers, LLC and is, or is in the nature of, a solicitation. This material is not a research report prepared by Powerhouse Brokers, LLC. By accepting this communication, you agree that you are an experienced user of the futures markets, capable of making independent trading decisions, and agree that you are not, and will not, rely solely on this communication in making trading decisions.
DISTRIBUTION IN SOME JURISDICTIONS MAY BE PROHIBITED OR RESTRICTED BY LAW. PERSONS IN POSSESSION OF THIS COMMUNICATION INDIRECTLY SHOULD INFORM THEMSELVES ABOUT AND OBSERVE ANY SUCH PROHIBITION OR RESTRICTIONS. TO THE EXTENT THAT YOU HAVE RECEIVED THIS COMMUNICATION INDIRECTLY AND SOLICITATIONS ARE PROHIBITED IN YOUR JURISDICTION WITHOUT REGISTRATION, THE MARKET COMMENTARY IN THIS COMMUNICATION SHOULD NOT BE CONSIDERED A SOLICITATION.
The risk of loss in trading futures and/or options is substantial and each investor and/or trader must consider whether this is a suitable investment. Past performance, whether actual or indicated by simulated historical tests of strategies, is not indicative of future results. Trading advice is based on information taken from trades and statistical services and other sources that Powerhouse Brokers, LLC believes are reliable. We do not guarantee that such information is accurate or complete and it should not be relied upon as such. Trading advice reflects our good faith judgment at a specific time and is subject to change without notice. There is no guarantee that the advice we give will result in profitable trades.
Copyright 2024 Powerhouse Brokers, LLC, All rights reserved