Diving Deeper Into Spread Trades
- Slow summer days afford the chance to sharpen skills
- Futures spreads analysis can offer additional market insights
- Spread trades key to natural gas market as well
- Weather-induced natural gas demand increases offset by supply
Sincerely
David Thompson, CMT
Executive Vice President
Powerhouse
(202) 333-5380
The Matrix
Two weeks ago, the Weekly Energy Market Situation mentioned the important information that can be gleaned from the spreads between futures contract months. Noteworthy changes in market sentiment are often signaled by transitions from carry into backwardation (and vice versa). That report discussed the longer-term ramifications of changes in the futures curve. This week, we will highlight potentially useful information that comes from short-term changes in futures spreads.
No fundamental statistic nor any technical indicator will ever perfectly predict future market behavior. Analysis is a tool, not a guarantee. The aim of technical analysis is to try to give market participants a more robust view of trading activity. Futures spreads can often do just that. In these examples we compare the behavior of the front-month ULSD futures contract versus the difference between the 1st and 3rd month ULSD futures contracts, expressed as a spread.
In Chart 1, the trading days of February 9, 12 and 13 are highlighted by the dotted yellow oval. At the end of February 13, market participants were wrestling with the question of whether the last two days of trading had broken the existing uptrend. Based on only the front-month futures contract, it appears close but not definitive.
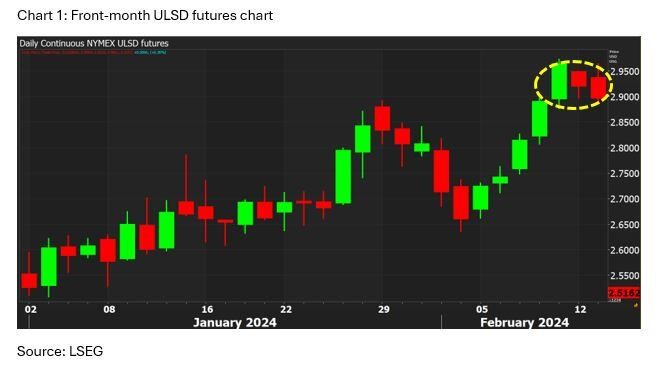
Chart 2 highlights the same three trading days. The 1st to 3rd month ULSD futures spread show a significantly different picture. The break of the uptrend is much clearer.

Chart 3 shows that over the following two weeks, bearish sentiment clearly took over the ULSD market. The difference in the intensity of the breakdown between the futures contract and the spread during the three-day segment served as an important technical alarm bell.
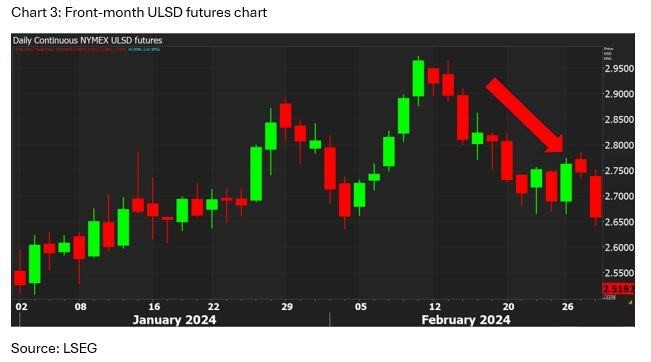
Does a change in the futures spread always presage the next market move. Absolutely not. The change in the spread offers an extra degree of nuance to the decision maker but should not be the only consideration. When analyzing markets, POWERHOUSE often looks at spread relationships to add another layer of detail to our assessments. If you would like more information on this technique, please contact us.
Supply/Demand Balances
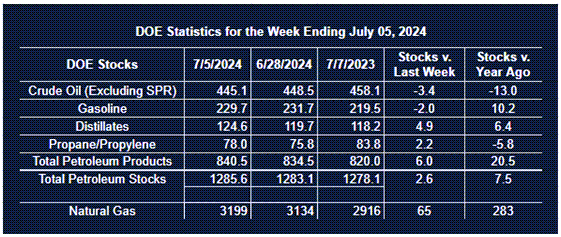
Supply/demand data in the United States for the week ended July 5, 2024, were released by the Energy Information Administration.
Total commercial stocks of petroleum increased (⬆) 2.6 million barrels to 1.2856 billion barrels during the week ended July 5th, 2024.
Commercial crude oil supplies in the United States were lower (⬇) by 3.4 million barrels from the previous report week to 445.1 million barrels.
Crude oil inventory changes by PAD District:
PADD 1: Up (⬆) 0.3 million barrels to 8.4 million barrels
PADD 2: Down (⬇) 0.1 million barrels to 115.9 million barrels
PADD 3: Down (⬇) 5.6 million barrels to 251.5 million barrels
PADD 4: Down (⬇) 0.2 million barrels to 23.2 million barrels
PADD 5: Up (⬆) 2.2 million barrels to 46.1 million barrels
Cushing, Oklahoma, inventories were down (⬇) 0.7 million barrels to 33.5 million barrels.
Domestic crude oil production was up (⬆) 100,000 barrels to 13.3 million barrels per day.
Crude oil imports averaged 6.760 million barrels per day, a daily increase (⬆) of 214,000 barrels. Exports decreased (⬇) 402,000 barrels daily to 3.999 million barrels per day.
Refineries used 95.4% of capacity; 1.9 percentage points more (⬆) than the previous report week.
Crude oil inputs to refineries increased (⬆) 317,000 barrels daily; there were 17.109 million barrels per day of crude oil run to facilities. Gross inputs, which include blending stocks, increased (⬆) 344,000 barrels daily to 17.487 million barrels daily.
Total petroleum product inventories increased (⬆) by 5.9 million barrels from the previous report week, up to 840.5 million barrels.
Total product demand decreased (⬇) 334,000 barrels daily to 20.749 million barrels per day.
Gasoline stocks decreased (⬇) 2 million barrels from the previous report week; total stocks are 229.7 million barrels.
Demand for gasoline decreased (⬇) 26,000 barrels per day to 9.398 million barrels per day.
Distillate fuel oil stocks increased (⬆) 4.9 million barrels from the previous report week; distillate stocks are at 124.6 million barrels. EIA reported national distillate demand at 3.466 million barrels per day during the report week, a decrease (⬇) of 249,000 barrels daily.
Propane stocks rose (⬆) 2.2 million barrels from the previous report to 78 million barrels. The report estimated current demand at 867,000 barrels per day, an increase (⬆) of 206,000 barrels daily from the previous report week.
Natural Gas
Spread trades are also closely watched in the natural gas futures market. Perhaps no trade is as famous (or infamous) as the March – April natural gas futures spread, known as ‘the widow maker’. This spread, which straddles the end of natural gas storage withdrawal season, and the beginning of injection season is often viewed by the market as a proxy for winter heating demand. Recently this spread traded at a differential of only 19 cents (March ’25 futures above the April ’25 NG contract). This level is very low on a historical basis for this date.
The current spate of hot weather has spurred natural gas demand with utilities burning a then-record 54.1 bcf per day of gas on July 9th. However, this demand increase is being more than offset in the market by an increase in U.S. gas output of 2.1 bcf per day so far in July versus the average from June. Additionally, the large LNG export facility at Freeport has been slow to return from damage suffered during Hurricane Beryl.
The price of the Nov-Mar winter NG strip has declined about 17% since Jun 11. $3.15 remains a key support zone. If market participants change their views on expectations for winter weather, then we would expect to see a concomitant move in the ‘widow maker’ spread.
According to the EIA:
- Net injections into storage totaled 65 Bcf for the week ended July 5, compared with the five-year (2019–2023) average net injections of 57 Bcf and last year’s net injections of 57 Bcf during the same week. Working natural gas stocks totaled 3,199 Bcf, which is 504 Bcf (18.7%) more than the five-year average and 283 Bcf (9.7%) more than last year at this time.
- According to The Desk survey of natural gas analysts, estimates of the weekly net change to working natural gas stocks ranged from net injections of 51 Bcf to 68 Bcf, with a median estimate of 59 Bcf.
- The average rate of injections into storage is 12% lower than the five-year average so far in the refill season (April through October). If the rate of injections into storage matched the five-year average of 8.6 Bcf/d for the remainder of the refill season, the total inventory would be 4,216 Bcf on October 31, which is 504 Bcf higher than the five-year average of 3,712 Bcf for that time of year.
Was this helpful? We’d like your feedback.
Please respond to [email protected]
This material has been prepared by a sales or trading employee or agent of Powerhouse Brokers, LLC and is, or is in the nature of, a solicitation. This material is not a research report prepared by Powerhouse Brokers, LLC. By accepting this communication, you agree that you are an experienced user of the futures markets, capable of making independent trading decisions, and agree that you are not, and will not, rely solely on this communication in making trading decisions.
DISTRIBUTION IN SOME JURISDICTIONS MAY BE PROHIBITED OR RESTRICTED BY LAW. PERSONS IN POSSESSION OF THIS COMMUNICATION INDIRECTLY SHOULD INFORM THEMSELVES ABOUT AND OBSERVE ANY SUCH PROHIBITION OR RESTRICTIONS. TO THE EXTENT THAT YOU HAVE RECEIVED THIS COMMUNICATION INDIRECTLY AND SOLICITATIONS ARE PROHIBITED IN YOUR JURISDICTION WITHOUT REGISTRATION, THE MARKET COMMENTARY IN THIS COMMUNICATION SHOULD NOT BE CONSIDERED A SOLICITATION.
The risk of loss in trading futures and/or options is substantial and each investor and/or trader must consider whether this is a suitable investment. Past performance, whether actual or indicated by simulated historical tests of strategies, is not indicative of future results. Trading advice is based on information taken from trades and statistical services and other sources that Powerhouse Brokers, LLC believes are reliable. We do not guarantee that such information is accurate or complete and it should not be relied upon as such. Trading advice reflects our good faith judgment at a specific time and is subject to change without notice. There is no guarantee that the advice we give will result in profitable trades.
Copyright 2024 Powerhouse Brokers, LLC, All rights reserved