

Oil Prices May Be Bottoming
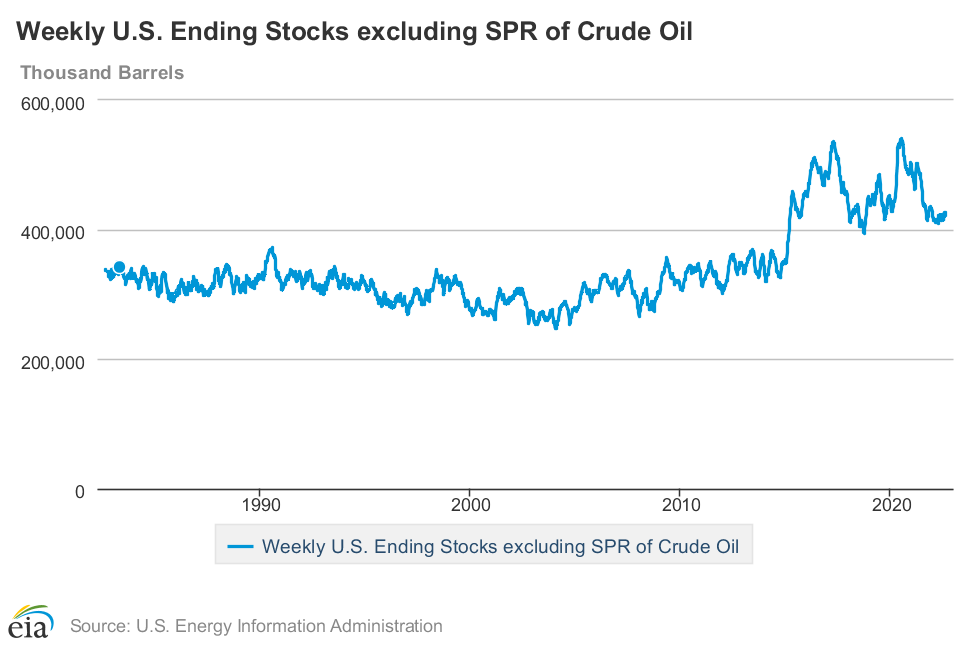
- Crude oil inventories starting to bottom
- ULSD open interest well below winter highs
- Recession fears may be abating
- Next winter temps could be very cold.
Sincerely,
Alan Levine, Chairman
Powerhouse
(202) 333-5380
The Matrix
Futures prices for petroleum liquids moved to new lows last week. Crude oil extended the retracement from its June highs, breaking below $90 per barrel for the first time since February 24 and the start of the Ukrainian invasion.
That war is now a grinding affair with Russia unable to score a decisive victory. And in the process, Russia has suffered serious economic damage with its exports of petroleum under duress.
Tight inventories of oil have supported price, and it is only in the past few weeks that the United States has shown signs of supply starting to stabilize.
Product prices have moved down too. And with next autumn/winter just around the corner, it is fair to ask if retreating prices are still in the cards. Seasonal bottoms for distillate fuels commonly occur at this time, and while open interest of ULSD has been slowly rising, the number of contracts is well below typical winter highs.
The general economy now shows both bullish and bearish elements. Inflation is a demand killer, but oil consumption, running at 19.9 million barrels daily in the United States, is near all-time highs. Notably, k-jet fuel demand clocked in at 1.4 million barrels per day for the week ended July 29, more than twenty percent higher than last year at this time. The extraordinary loss of demand to the pandemic appears to have been regained.
Fears of recession appear to have been tempered by July’s employment data. The nation added 528,000 nonfarm jobs to payrolls. This brought the unemployment rate to 3.5%, matching a fifty-year low. At the same time, high employment encourages inflation. Even further interest rate tightening should be expected extracting its own price on economic growth.
Where does this leave us? Technical trading shows statistics like the MACD and RSI going flat, but with no divergence yet apparent. Fundamentals, like weather, have produced higher-than-normal CCDs, but little destruction from hurricanes. NOAA remains committed to an above-average season, “with three to five major hurricanes likely and a dozen or more named storms probable.”
A recovery above $3.35 seems to be a minimum level to assume a sustainable rally in ULSD.
Supply/Demand Balances
Supply/demand data in the United States for the week ended July 29, 2022, were released by the Energy Information Administration.
Total commercial stocks of petroleum rose 3.5 million barrels during the week ended July 29, 2022.
Commercial crude oil supplies in the United States increased by 4.5 million barrels from the previous report week to 426.6 million barrels.
Crude oil inventory changes by PAD District:
PADD 1: UNCH at 7.5 million barrels
PADD 2: Plus 3.5 million barrels to 107.8 million barrels
PADD 3: Down 1.6 million barrels to 237.7 million barrels
PADD 4: Plus 0.1 million barrels to 23.7 million barrels
PADD 5: Plus 2.5 million barrels to 49.9 million barrels
Cushing, Oklahoma, inventories were up 1.0 million barrels from the previous report week to 24.5 million barrels.
Domestic crude oil production was up UNCH from the previous report week at 12.1 million barrels daily.
Crude oil imports averaged 7.342 million barrels per day, a daily increase of 1,178,000 barrels. Exports decreased 1,036,000 barrels daily to 3.512 million barrels per day.
Refineries used 92.2% of capacity; 1.2 percentage points lower than the previous report week.
Crude oil inputs to refineries decreased 174,000 barrels daily; there were 16.027 million barrels per day of crude oil run to facilities. Gross inputs, which include blending stocks, fell 220,000 barrels daily to 16.320 million barrels daily.
Total petroleum product inventories fell by 1.0 million barrels from the previous report week, rising to 782.3 million barrels.
Total product demand decreased 27,000 barrels daily to 19.948 million barrels per day.
Gasoline stocks increased 0.2 million barrels from the previous report week; total stocks are 225.3 million barrels.
Demand for gasoline fell 704,000 barrels per day to 8.541 million barrels per day.
Distillate fuel oil stocks decreased 2.4 million barrels from the previous report week; distillate stocks are at 109.3 million barrels. EIA reported national distillate demand at 3.877 million barrels per day during the report week, an increase of 127,000 barrels daily.
Propane stocks were up 1.8 million barrels from the previous report week to 63.6 million barrels. The report estimated current demand at 746,000 barrels per day, an increase of 119,000 barrels daily from the previous report week.
Natural Gas
The “shooting star” candlestick pattern discussed in Powerhouse’s Weekly Energy Market Situation last week further confirmed a top in natural gas prices—at least in the near-term. Natural gas futures traded a $7.50-$8.50 range, despite higher-than-normal Cooling Degree Days for the week ended July 28. Nationally, fifteen more CDDs were recorded. New England and the Middle Atlantic states sweltered through 28 more-than-normal CDDs.
Last week’s range-bound trading in spot natural gas futures was in conflict with early expectations for the upcoming heating season. In August, the parade of winter weather forecasts begins.
Perhaps the most venerable of these is the Farmer’s Almanac, published annually since 1818. It is projecting a very cold winter in the eastern half of the country. The Almanac puts the coldest weather in the Northeast, Great Lakes and North Central regions. It suggests temperatures to 40° below zero in Mid-January in these areas.
The EIA reports current injections into storage running 5% below the five-year average. Natural gas stocks could start next winter’s withdrawal period with only 3.3 Tcf of supply.
According to the EIA:
The net injections into storage totaled 41 Bcf for the week ended July 29, compared with the five-year (2017–2021) average net injections of 33 Bcf and last year’s net injections of 16 Bcf during the same week. Working natural gas stocks totaled 2,457 Bcf, which is 12%, or 337 Bcf, lower than the five-year average and 10%, or 268 Bcf, lower than last year at this time.
The average rate of injections into storage is 5% lower than the five-year average so far in the refill season (April through October). If the rate of injections into storage matched the five-year average of 9.0 Bcf/d for the remainder of the refill season, the total inventory would be 3,308 Bcf on October 31, which is 337 Bcf lower than the five-year average of 3,645 Bcf for that time of year.
Was this helpful? We’d like your feedback.
Please respond to [email protected]
Powerhouse Futures & Trading Disclaimer
Copyright 2022 Powerhouse Brokerage, LLC, All rights reserved


