Excerpted from This Week In Petroleum, July 5 2018
Many analysts use the motor gasoline product supplied data in the U.S. Energy Information Administration’s (EIA) Weekly Petroleum Status Report (WPSR) to discern trends in U.S. gasoline consumption. To interpret the data effectively, it is important to understand what product supplied is and what it is not. The large scale and timing of each of the components of product supplied can sometimes lead to week-to-week changes in product supplied volumes that are not indicative of actual consumption patterns. Because of these dynamics, finished motor gasoline product supplied measured using a four-week rolling average is a more robust method of discerning trends.
Product supplied is estimated by the volume of petroleum products delivered out of the primary supply chain. Although these products are ultimately consumed, product supplied measures their volumes further up the supply chain than at the point of consumption, which is why product supply is only a proxy for demand.
For motor gasoline, the primary supply chain includes refineries, bulk terminals and blenders, importers, exporters, and pipelines. All of these primary supply chain components handle large volumes of product on a daily basis. Therefore, changes in one or more of these sources of supply (e.g., one or two additional shipments in or out during the week) are of a large enough scale to cause an individual week’s product supplied to swing up or down markedly. Using an average of product supplied across several weeks smooths these volumetric swings and provides a more useful measure of demand trends.
EIA derives product supplied for finished motor gasoline by comparing how much gasoline was produced by refiners and blenders, how much gasoline was imported, how much gasoline was exported, and how much gasoline was delivered to or from storage within the referenced week. Product supplied is a much more efficient way for EIA to accurately sample these various supplies, but it does not directly assess sales of motor gasoline at retail stations for consumption by end users.
Retail stations are considered secondary storage—the portion of the overall distribution network that falls between producers and end users. As holders of secondary storage, retail stations are not surveyed or included in the WPSR product supplied calculations. Instead, product supplied captures the transfer of supplies from the primary supply chain to these secondary storage facilities.
For example, a refinery might decide to move a larger-than-normal volume of product to a distributor’s secondary storage facility in Week 1, resulting in a large reduction in primary stock levels. As a result, product supplied might appear to increase in Week 1, followed by a drop in product supplied the next week if less of that product is moved out of primary inventory in Week 2. In this simplified example, based solely on the reported changes in stock levels each week, reported product supplied might initially appear to drop considerably from Week 1 to Week 2, when the cause was actually just the result of a refiner’s business decision to move this product out of primary storage over one week rather than two weeks. In this case, using a two-week average to view the impact of aggregate inventory changes would likely provide a better proxy for consumption over the entire 14-day period.
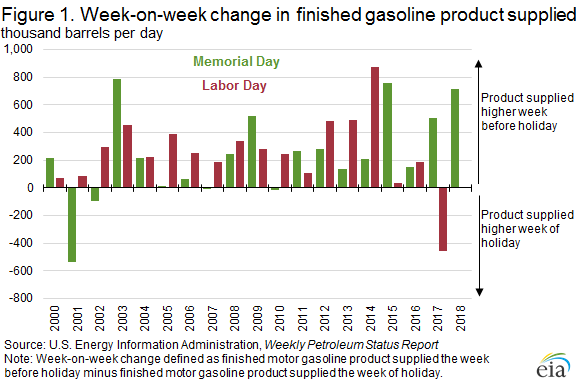
This situation could occur in any given week for a number of reasons, but it is common during U.S. holiday weekends that are associated with increased driving. In anticipation of the increased demand for gasoline, the primary supply chain will increase deliveries to retail stations, thereby increasing product supplied. Because the data WPSR respondents report cover weekly activities as of Friday at 7:00 a.m. Eastern Time, most of the transfer from primary to secondary storage in anticipation of holiday weekend driving happens in the week before the holiday. Therefore, weeks ending the Friday before a three-day holiday weekend, such as Memorial Day Weekend or Labor Day Weekend, tend to have higher motor gasoline product supplied than the weeks on which the actual holiday takes place (Figure 1). Again, using a four-week average of product supplied as a proxy for demand will provide better insight for actual consumption trends.
The opposite pattern typically applies for Thanksgiving, another major U.S. travel holiday. Because Thanksgiving always occurs on a Thursday, most of the transfers of gasoline from primary to secondary storage (an increase to product supplied) and the actual holiday-induced demand occur within the same week. Therefore, the week of Thanksgiving typically has a higher motor gasoline product supplied than the week prior (Figure 2).

In addition to holidays, variables affecting the different supply types captured in product supplied can lead to large week-to-week changes in product supplied that are not meaningful in distinguishing the beginning of a new trend, the end of an existing trend, or simply a one-week anomaly.
For example, the timing and scale of imports or exports can make product supplied appear high one week and then lower the next (or vice versa). If a large volume of gasoline is scheduled to be imported on Friday morning, but gets delayed and the import paperwork does not clear customs by the 7:00 a.m. deadline, that volume of gasoline will not appear in EIA’s data for that week, but rather in EIA’s data for the next week. As a result, Week 1 product supplied appears lower, and Week 2 product supplied higher.
Week-to-week changes in finished motor gasoline product supplied because of the timing of product delivery out of primary storage around holidays and timing of large bulk shipments into and out of the primary supply chain are just two of the several reasons why using a rolling four-week average of product supplied is a more effective way of determining trends in motor gasoline demand. Furthermore, gasoline consumption patterns should be put into context with other broad factors that can influence motor gasoline demand, such as retail gasoline prices, the overall status of the economy, and weather.