Analysis by Dr. Nancy Yamaguchi
This year brought a milestone to the US natural gas industry: the shipping of the first cargo of liquefied natural gas (LNG) from the new Sabine Pass Liquefaction LLC Train 1. Four additional trains are underway. Building an LNG facility is a capital-intensive process. This new LNG facility was also a political process because of the numerous rounds of environmental and permitting reviews. But it was viewed as critical in order to keep US natural gas flowing. Why does it matter so much to expand export opportunities?
“Liquidity” is the word, there is no “Gassidity”
We have noted that one of the most important characteristics of oil is that it is a liquid. Containing and transporting a liquid is simple when compared to containing and transporting a gas. The very term “liquidity” means how quickly an asset can be sold or converted. “Liquidity” has connotations of profitability and convenience. There is not even a word “gassidity,” but if we invented it, it would probably mean “difficult to contain,” or “not easy to sell.”
The Shale Boom in the US increased not only oil production, but natural gas production as well. Although natural gas consumption has risen, it has not risen as quickly as production. The consequences are that more natural gas is being stored, more natural gas is being exported, and less natural is being imported.
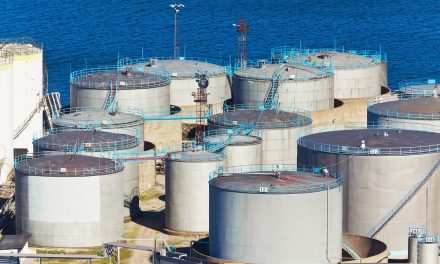
Storing natural gas is not as simple as storing liquid oil. According to the Energy Information Administration (EIA,) working gas in storage totaled 3,179 Bcf as of Friday, July 1, 2016. This was a net increase of 39 Bcf from the previous week. Stocks were 538 Bcf higher than last year at the same, and stocks are 599 Bcf above the five-year average of 2,580 Bcf. The total working gas of 3,179 Bcf is above the five-year historical range. The following chart is the EIA’s data on working gas in underground storage, with the blue line showing how lower-48 natural gas in storage has crept above the 5-year range this year.
Note: The shaded area indicates the range between the historical minimum and maximum values for the weekly series from 2011 through 2015. The dashed vertical lines indicate current and year-ago weekly periods.

Click to enlarge
US natural gas exports are rising, imports are falling
With underground storage inventories already above 5-year averages, dealing with increased natural gas output is a matter of import substitution and export growth. As the next figure shows, both of these are occurring to an extraordinary degree. If we consider the decade from 2005 through 2015, US natural gas imports dropped at a rate averaging -4.6% per year. In stark contrast, US natural gas exports grew at a rate averaging 9.4% per year. If additional export avenues open up, the US could become a net exporter of natural gas.

Click to enlarge
Liquefied natural gas can reach higher-value markets
For North American natural gas producers, adding the capability to export liquefied natural gas grants access to the highest value export markets. The next figure compares the price of natural gas, in US$ per million BTU, in four key locations, demonstrating the huge disparity in prices:
- Alberta, Canada, 2015 price=$2.01/MMBTU
- Henry Hub, United States, 2015 price=$2.60/MMBTU
- Germany, 2015 average import price=$6.61
- Japan, 2015 average LNG import price=$10.31

Click to enlarge
The caveats: not everyone can sell to Japan, or compete in Europe.
The increase in US natural gas output is being handled in four ways:
- Increased domestic consumption
- Increased storage
- Import substitution
- Export growth
Pipeline exports of natural gas have grown, but geography dictates that US pipeline gas exports head to Canada or to Mexico. To the north, Canadian natural gas is less expensive than US natural gas, so Canadian exports to the US are more common than US exports to Canada. To the south, however, pipeline exports to Mexico are soaring, and more growth is expected. But according to the EIA, the average price of pipeline natural gas exports to Mexico in 2015 was $2.81/thousand cubic feet. The average price of LNG exports was much higher–$10.92/thousand cubic feet. Clearly, LNG exports are heading to higher-value markets such as Japan. Just as clearly, not everyone can sell LNG to Japan (which may indeed be a shrinking market,) nor can US gas exporters necessarily compete in Europe with pipeline natural gas exports from Russia, or potentially from Iran in the future. Nonetheless, expanding US LNG export capability must be viewed as critical to cope with expanding output.
 Dr. Nancy Yamaguchiis an author and petroleum industry expert specializing in the advanced analysis of energy markets. Dr. Yamaguchi is the President of Trans-Energy Research Associates, Inc. focusing on a wide spectrum of fuel related issues such as economics and the environment. She possesses a strong interest in global oil industry, including supply, demand, trading trends, as well as transport, refining, product blending, alternative and reformulated fuels, product quality and price behavior. Dr. Yamaguchi can be reached at [email protected].