Drought Threatens Global Economic Development
- POWERHOUSE turns ten
- Drought world-wide is expanding
- Depressed river levels in Europe inhibit oil transport and nuclear cooling
- Meteorologists remain bullish on tropical activity.
Sincerely,
Alan Levine, Chairman
Powerhouse
(202) 333-5380
A Note to Our Readers
Yesterday, September 6, marked the tenth anniversary of POWERHOUSE. Ten years ago, Alan Levine, Elaine Levin, and David Thompson established this company after many years’ service at Morgan Stanley (and its predecessors.) We were joined by our COO, Matt Walker. William Wilson became part of the team in 2014.
POWERHOUSE has been a success by any measure. According to the Bureau of Labor Statistics, approximately 20% of new businesses fail during the first two years of being open, 45% during the first five years, and 65% during the first 10 years. We have passed that mark, and will be one of the 25% that reach 15 years.
Our business is sound with many well-established clients. More important, we are still growing with improved results every year.
Our friends and clients have played an important role in our success. We value all of you.
Thank you all again. We love serving you and appreciate the love we get in return.
Alan Levine
POWERHOUSE
The Matrix
The luxury of an extended Labor Day weekend offers Powerhouse the chance to think about a topic larger than this winter’s ULSD supply in the Northeast. Regional supply is, of course, important and we have looked at the situation recently.
Availability of ULSD and all other liquid fuels is more problematic than before. Drought outside of the United States (and in the American West,) might affect domestic supplies as generation from hydropower and transportation from lowering rivers affect the allocation of liquid oils and coal.
Drought in China and in Europe are two contributors to emerging shortfalls in supply. They have important implications for fuels but even greater risks for larger environmental concerns.
China depends heavily on hydroelectricity for power. The world’s largest power station, at Three Gorges Dam on the Yangtze River, can reportedly produce the equivalent of 20 nuclear power plants. There are two more generators upstream that, together, produce enough to power a moderate-sized European country. Daily generation from these plants, however, has fallen by half since the early 1960’s.
Rivers from the Tibetan Plateau water about the half the world’s population. Additional hydro power has been planned for India, Pakistan, Nepal and Bhutan. As global drying advances, demand for alternative generating fuels will turn to coal, a major pollutant. This, of course, works back throughout the energy supply sector. Further damage to international commerce could ensue and stifle development.
European heat has registered above 104° this summer. Electricity demand – and power prices—have surged. And drought has reportedly spread from Germany to Portugal. Some commentators believe this could worsen the energy crises for far longer than just this year. This comes while the EU seeks to cut its reliance on Russian energy supplies.
The Alps and the Pyrenees got less snow than usual last winter. We have noted steep declines in water levels on the Rhine. Many other waterways have been hit, notably the Rhone and the Po. Ramifications are widespread. Coal-fired power plants in Germany and water-cooled nuclear facilities in France are subject to river levels, leaving the EU with renewables and natural gas as its other energy sources. The impact on liquid fuels in unknowable but a real risk to global balances.
Supply/Demand Balances
Supply/demand data in the United States for the week ended August 26, 2022, were released by the Energy Information Administration.
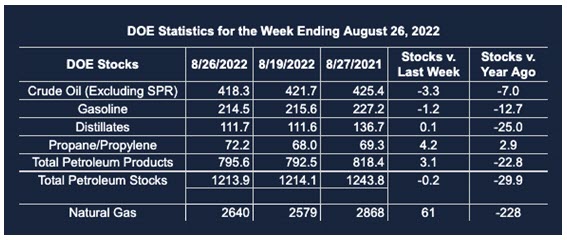
Total commercial stocks of petroleum fell 0.2 million barrels during the week ended August 26, 2022.
Commercial crude oil supplies in the United States decreased by 3.3 million barrels from the previous report week to 418.3 million barrels.
Crude oil inventory changes by PAD District:
PADD 1: Down 0.4 million barrels to 7.6 million barrels
PADD 2: Down 1.6 million barrels to 109.4 million barrels
PADD 3: Down 1.7 million barrels to 231.4 million barrels
PADD 4: Down 0.4 million barrels to 22.3 million barrels
PADD 5: Plus 0.7 million barrels to 49.1 million barrels
Cushing, Oklahoma, inventories were down 0.5 million barrels from the previous report week to 25.3 million barrels.
Domestic crude oil production was up 100,000 barrels per day from the previous report week to 12.1 million barrels daily.
Crude oil imports averaged 5.956 million barrels per day, a daily decrease of 216,000 barrels. Exports decreased 210,000 barrels daily to 3.967 million barrels per day.
Refineries used 93.8% of capacity; 0.3 percentage points higher than the previous report week.
Crude oil inputs to refineries decreased 17,000 barrels daily; there were 16.238 million barrels per day of crude oil run to facilities. Gross inputs, which include blending stocks, fell 198,000 barrels daily to 16.628 million barrels daily.
Total petroleum product inventories rose by 3.1 million barrels from the previous report week, rising to 795.6 million barrels.
Total product demand decreased 734,000 barrels daily to 20.073 million barrels per day.
Gasoline stocks declined 1.2 million barrels from the previous report week; total stocks are 214.5 million barrels.
Demand for gasoline rose 157,000 barrels per day to 8.591 million barrels per day.
Distillate fuel oil stocks increased 0.1 million barrels from the previous report week; distillate stocks are at 111.7 million barrels. EIA reported national distillate demand at 3.566 million barrels per day during the report week, a decrease of 321,000 barrels daily.
Propane stocks were increased by 4.2 million barrels from the previous report week to 72.2 million barrels. The report estimated current demand at 646,000 barrels per day, a decrease of 117,000 barrels daily from the previous report week.
Natural Gas
Spot futures prices for natural gas at Henry Hub last week averaged slightly above $9.20. This may reflect easing temperatures. CDDs for the week ended August 25 lagged last year by 13 days for the nation as a whole. The Pacific region was brutally hot, generating 42 more CDDs than last year at this time. East of the Rockies, CDDs in most areas lagged significantly. The East North Central region of the United States generated 40 CDDs, forty days less than last year. Other areas were not quite so impressive, but lower everywhere else.
The absence of meaningful tropical activity could have made a difference in demand expectations and price too. But September lies ahead, and with it the peak of hurricane season. More Category 5 hurricanes occur in September. August is second, but lags well behind.
Forecasters for Accuweather remain bullish on tropical activity. “Those forces that shut down tropical activity earlier in the season are not expected to hinder systems from becoming better organized this fall. The result will be a lopsided hurricane season with most of the tropical storms and hurricanes predicted to develop after Sept. 10, the climatological peak of the Atlantic hurricane season.
According to the EIA:
Net injections [of natural gas] into storage totaled 61 Bcf for the week ended August 26, compared with the five-year (2017–2021) average net injections of 46 Bcf and last year’s net injections of 21 Bcf during the same week. Working natural gas stocks totaled 2,640 Bcf, which is 338 Bcf (11%) lower than the five-year average and 228 Bcf (8%) lower than last year at this time.
The average rate of injections into storage is 4% lower than the five-year average so far in the refill season (April through October). If the rate of injections into storage matched the five-year average of 10.1 Bcf/d for the remainder of the refill season, the total inventory would be 3,307 Bcf on October 31, which is 338 Bcf lower than the five-year average of 3,645 Bcf for that time of year.
Was this helpful? We’d like your feedback.
Please respond to [email protected]
Powerhouse Futures & Trading Disclaimer
Copyright 2022 Powerhouse Brokerage, LLC, All rights reserved