OPEC+: Will They, or Won’t They?
- OPEC+ scheduled to roll back voluntary cuts gradually starting in October
- China’s demand data disappoints again
- Bank analysts revising crude oil price forecasts lower
- Freeport LNG exports return fully in August
Sincerely
Elaine Levin,
President
Powerhouse
(202) 333-5380
The Matrix
China has been a significant source of new demand for industrial commodities for the last 25 years. Growth in China’s manufacturing, infrastructure, and real estate required large amounts of iron ore, concrete, copper, and, of course, energy. If the economy started to soften, Beijing would stimulate its economy through construction projects. Post-pandemic, this strategy has hit its limits. Property prices fell while China’s debt rose. Without ongoing stimulus, the latest slowdown in China’s economy is becoming OPEC’s problem.
Through a series of production cuts, OPEC+ has supported WTI crude prices near $80.00 throughout 2024. OPEC’s restraint allowed non-OPEC producers to increase production and market share. The U.S. recently set a new production record at 13.4 million barrels per day. Brazil’s output is growing rapidly. Even Norway maintained steady North Sea production despite much less optimistic forecasts. As Bloomberg columnist Javier Blas recently wrote, “OPEC+ is a victim of its own success.”
OPEC+’s spare capacity has been an effective buffer against events that typically increase prices. Military action involving Israel and Iran has barely moved the needle. Most recently, a political standoff in Libya halted exports from important ports. Once again, the market reaction was muted.
At the June 2024 meeting, OPEC+ agreed that voluntary cuts for eight countries, including Saudi Arabia, the UEA, and Iraq, would be gradually phased out starting in October. China’s demand woes are a fly in the ointment. China recently reported that manufacturing activity slowed to a six-month low in August. The ongoing weakness in China, along with cooling economies in the U.S. and Europe, have led analysts at the large banks to lower price forecasts. Surplus production predictions are even on the table for 2025.
Right before Labor Day weekend, OPEC+ signaled their willingness to go forward with the production increases. The oil markets sold off. Of course, OPEC+ reserves the right to change their minds. The latest agreement states, “This monthly increase can be paused or reversed subject to market conditions.” But for the moment, traders are taking them at their word.
OPEC+ had hoped demand growth from China would lessen the impact of increasing production. That is looking less likely. Be prepared for “will they or won’t they” headlines as we approach October.
Supply/Demand Balances
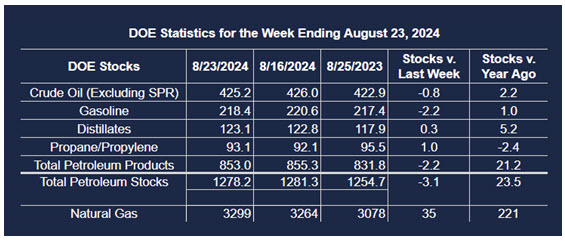
Supply/demand data in the United States for the week ended August 23, 2024, were released by the Energy Information Administration.
Total commercial stocks of petroleum decreased (⬇) 3.1 million barrels to 1.2782 billion barrels during the week ended August 23, 2024.
Commercial crude oil supplies in the United States were lower (⬇) by 0.8 million barrels from the previous report week to 425.2 million barrels.
Crude oil inventory changes by PAD District:
PADD 1: Up (⬆) 1.1 million barrels to 8.8 million barrels
PADD 2: Down (⬇) 1.5 million barrels to 105.1 million barrels
PADD 3: Up (⬆) 0.5 million barrels to 240.2 million barrels
PADD 4: Down (⬇) 0.3 million barrels to 22.1 million barrels
PADD 5: Down (⬇) 0.7 million barrels to 48.9 million barrels
Cushing, Oklahoma, inventories were down (⬇) 0.7 million barrels to 27.5 million barrels.
Domestic crude oil production decreased by 100,000 barrels (⬇) to 13.3 million barrels per day.
Crude oil imports averaged 6.560 million barrels per day, a daily decrease (⬇) of 92,000 barrels. Exports decreased (⬇) 374,000 barrels daily to 3.671 million barrels per day.
Refineries used 93.3% of capacity; 1 percentage point more (⬆) than the previous report week.
Crude oil inputs to refineries increased (⬆) 175,000 barrels daily; there were 16.864 million barrels per day of crude oil run to facilities. Gross inputs, which include blending stocks, increased (⬆) 194,000 barrels daily to 17.101 million barrels daily.
Total petroleum product inventories decreased (⬇) by 2.3 million barrels from the previous report week, down to 853 million barrels.
Total product demand increased (⬆) 1,170,000 barrels daily to 21.592 million barrels per day.
Gasoline stocks decreased (⬇) 2.2 million barrels from the previous report week; total stocks are 218.4 million barrels.
Demand for gasoline increased (⬆) 115,000 barrels per day to 9.307 million barrels per day.
Distillate fuel oil stocks increased (⬆) 0.3 million barrels from the previous report week; distillate stocks are at 123.1 million barrels. EIA reported national distillate demand at 3.822 million barrels per day during the report week, an increase (⬆) of 246,000 barrels daily.
Propane stocks rose (⬆) 1 million barrels from the previous report to 93.1 million barrels. The report estimated current demand at 1.027 million barrels per day, an increase (⬆) of 598,000 barrels daily from the previous report week.
Natural Gas
LNG exports from Freeport rebounded in August after operations were interrupted as Hurricane Beryl made landfall in early July. Freeport is the U.S.’s second-largest LNG export facility, with capacity to liquify 2.1 Bcf/d of natural gas. Given its size, it is not uncommon for operations at the plant to impact natural gas prices. This would typically be bullish news.
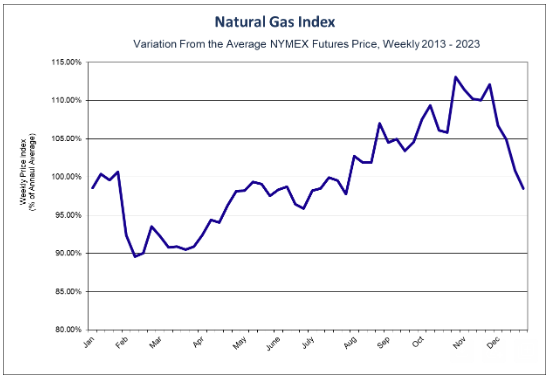
With the expiration of the September 2024 contract, spot October futures have held above $2.00. Seasonally, this is when natural gas prices should be on their way to the seasonal high price. China’s economic woes, along with strong domestic production, are weighing on natural gas prices too. The export capacity may be operational, but global demand is needed to support price. While traders wait for winter in the Northern Hemisphere, $2.00 support is still vulnerable.
According to the EIA:
- Working gas in storage was 3,334 Bcf as of Friday, August 23, 2024, according to EIA estimates. This represents a net increase of 35 Bcf from the previous week. Stocks were 228 Bcf higher than last year at this time and 361 Bcf above the five-year average of 2,973 Bcf. At 3,334 Bcf, total working gas is within the five-year historical range.
Was this helpful? We’d like your feedback.
Please respond to [email protected]
This material has been prepared by a sales or trading employee or agent of Powerhouse Brokers, LLC and is, or is in the nature of, a solicitation. This material is not a research report prepared by Powerhouse Brokers, LLC. By accepting this communication, you agree that you are an experienced user of the futures markets, capable of making independent trading decisions, and agree that you are not, and will not, rely solely on this communication in making trading decisions.
DISTRIBUTION IN SOME JURISDICTIONS MAY BE PROHIBITED OR RESTRICTED BY LAW. PERSONS IN POSSESSION OF THIS COMMUNICATION INDIRECTLY SHOULD INFORM THEMSELVES ABOUT AND OBSERVE ANY SUCH PROHIBITION OR RESTRICTIONS. TO THE EXTENT THAT YOU HAVE RECEIVED THIS COMMUNICATION INDIRECTLY AND SOLICITATIONS ARE PROHIBITED IN YOUR JURISDICTION WITHOUT REGISTRATION, THE MARKET COMMENTARY IN THIS COMMUNICATION SHOULD NOT BE CONSIDERED A SOLICITATION.
The risk of loss in trading futures and/or options is substantial and each investor and/or trader must consider whether this is a suitable investment. Past performance, whether actual or indicated by simulated historical tests of strategies, is not indicative of future results. Trading advice is based on information taken from trades and statistical services and other sources that Powerhouse Brokers, LLC believes are reliable. We do not guarantee that such information is accurate or complete and it should not be relied upon as such. Trading advice reflects our good faith judgment at a specific time and is subject to change without notice. There is no guarantee that the advice we give will result in profitable trades.
Copyright 2024 Powerhouse Brokers, LLC, All rights reserved