Looking East, Looking South
- Impact of U.S. Fed rate decision spreads
- Chinese financial policy makers consider actions
- Severe drought grips South America
- Bullish fundamentals & technicals drive natural gas prices
Sincerely,
David Thompson, CMT
Executive Vice President
Powerhouse
(202) 333-5380
The Matrix
The U.S. Federal Reserve’s decision to lower rates will have ripple effects across global markets. The decline in U.S. interest rates should cause the U.S. dollar to weaken, all other things remaining equal. Conventional wisdom holds that a weaker U.S. dollar is bullish for oil prices as it enables foreign purchasers to buy more. The track record of that idea panning out is inconsistent. But there may be another critical side effect that comes to pass.
The Fed’s decision may offer Chinese authorities more leeway to enact stimulus plans without as much pressure to defend the value of their currency as they consider adding financial stimulus to their economy.
Chinese financial leaders announced a rare briefing on the economy in conjunction with a cut in short-term policy rates. Market-watchers speculate this might be the opening salvo of another round of policy efforts designed to help the economy reach its 5% annual growth target.
Looking to the south, the most prolonged and severe drought in decades is gripping South America. Precipitation has been at least 20% below multi-year averages in nearly all the regions with some of the most acute shortages in the critical Andean region. This has dramatically affected river flows and hydroelectric power generation.
Global energy markets learned in 2008 that hydroelectric power shortfalls in South America can lead to a sharp demand increase for diesel fuel as a substitute. Summer power outages in Argentina are not uncommon. However, analysts were surprised by senior administration officials blunt and early announcement for the need to schedule power cuts. While residential customers may have to suffer outages, industries critical to the global economy – Chilean copper production for example—would likely resort to back-up diesel powered generation if this situation worsens.
As the long-term bearish price action persists in the major energy commodities, keep an eye on these two potential trend-changers.
Supply/Demand Balances
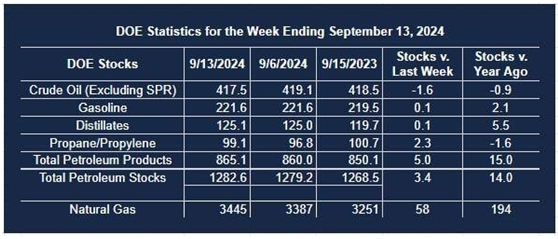
Supply/demand data in the United States for the week ended September 13, 2024, were released by the Energy Information Administration.
Total commercial stocks of petroleum increased (⬆) 3.4 million barrels to 1.2826 billion barrels during the week ended September 13, 2024.
Commercial crude oil supplies in the United States were lower (⬇) by 1.6 million barrels from the previous report week to 417.5 million barrels.
Crude oil inventory changes by PAD District:
PADD 1: Up (⬆) 0.1 million barrels to 8.0 million barrels
PADD 2: Down (⬇) 2.2 million barrels to 99.5 million barrels
PADD 3: Up (⬆) 1.8 million barrels to 240.8 million barrels
PADD 4: Up (⬆) 0.2 million barrels to 22.9 million barrels
PADD 5: Down (⬇) 1.5 million barrels to 47.2 million barrels
Cushing, Oklahoma, inventories were down (⬇) 2.0 million barrels to 22.7 million barrels.
Domestic crude oil production decreased (⬇) by 100,000 barrels to 13.2 million barrels per day.
Crude oil imports averaged 6.322 million barrels per day, a daily decrease (⬇) of 545,000 barrels. Exports increased (⬆) 1,284,000 barrels daily to 4.589 million barrels per day.
Refineries used 92.1% of capacity; a decrease (⬇) of 0.7% from the previous report week.
Crude oil inputs to refineries decreased (⬇) 283,000 barrels daily; there were 16.477 million barrels per day of crude oil run to facilities. Gross inputs, which include blending stocks, decreased (⬇) 134,000 barrels daily to 16.877 million barrels daily.
Total petroleum product inventories increased (⬆) by 5.0 million barrels from the previous report week, up to 865.1 million barrels.
Total product demand increased (⬆) 409,000 barrels daily to 19.792 million barrels per day.
Gasoline stocks remained unchanged (=) from the previous report week; total stocks are 221.6 million barrels.
Demand for gasoline increased (⬆) 298,000 barrels per day to 8.776 million barrels per day.
Distillate fuel oil stocks increased (⬆) 0.1 million barrels from the previous report week; distillate stocks are at 125.1 million barrels. EIA reported national distillate demand at 3.798 million barrels per day during the report week, an increase (⬆) of 240,000 barrels daily.
Propane stocks rose (⬆) 2.3 million barrels from the previous report to 99.1 million barrels. The report estimated current demand at 607,000 barrels per day, a decrease (⬇) of 216,000 barrels daily from the previous report week.
Natural Gas
Last week marked the fifth out of the last six that U.S. energy producers have cut the number of oil & gas rigs in service. Price action for the front-month NYMEX futures contract hit a 12-week high on Monday, September 23.
Technical analysis of the front-month natural gas futures chart shows a breakout of the $1.85-$2.30 trading range that had contained the price action for several months. This augurs for a test to the vicinity of $2.75. That price level also coincides with certain Fibonacci retracement levels. Should the front-month futures contract fall back under $2.35, the current bullish sentiment will be neutralized.
Was this helpful? We’d like your feedback.
Please respond to [email protected]
This material has been prepared by a sales or trading employee or agent of Powerhouse Brokers, LLC and is, or is in the nature of, a solicitation. This material is not a research report prepared by Powerhouse Brokers, LLC. By accepting this communication, you agree that you are an experienced user of the futures markets, capable of making independent trading decisions, and agree that you are not, and will not, rely solely on this communication in making trading decisions.
DISTRIBUTION IN SOME JURISDICTIONS MAY BE PROHIBITED OR RESTRICTED BY LAW. PERSONS IN POSSESSION OF THIS COMMUNICATION INDIRECTLY SHOULD INFORM THEMSELVES ABOUT AND OBSERVE ANY SUCH PROHIBITION OR RESTRICTIONS. TO THE EXTENT THAT YOU HAVE RECEIVED THIS COMMUNICATION INDIRECTLY AND SOLICITATIONS ARE PROHIBITED IN YOUR JURISDICTION WITHOUT REGISTRATION, THE MARKET COMMENTARY IN THIS COMMUNICATION SHOULD NOT BE CONSIDERED A SOLICITATION.
The risk of loss in trading futures and/or options is substantial and each investor and/or trader must consider whether this is a suitable investment. Past performance, whether actual or indicated by simulated historical tests of strategies, is not indicative of future results. Trading advice is based on information taken from trades and statistical services and other sources that Powerhouse Brokers, LLC believes are reliable. We do not guarantee that such information is accurate or complete and it should not be relied upon as such. Trading advice reflects our good faith judgment at a specific time and is subject to change without notice. There is no guarantee that the advice we give will result in profitable trades.
Copyright 2024 Powerhouse Brokers, LLC, All rights reserved