The Oil Paradox – Looming Glut vs. Geopolitical Risk
- Analysts are anticipating an oil surplus into next year
- OPEC+ expected to hold production steady
- Distillate supplies in the U.S. and Europe are tight ahead of winter
- Summer weather in the rearview mirror for many parts of the U.S.
Sincerely,
Elaine Levin
President
Powerhouse
(202) 333-5380
The Matrix
The EIA reported that U.S. crude oil production hit a new record high in June. The U.S. produced 13.58 million barrels per day. Other non-OPEC production is growing as well. Producers in Canada, Brazil, and Guyana are adding supply. Economic headwinds are weighing on global consumption. With this backdrop, OPEC+ decided to fully unwind voluntary cuts of 2.2 million barrels per day a full year ahead of schedule. While analysts anticipate that the members will keep production steady when OPEC+ meets on Sunday, the consensus view is still that the crude oil markets will be oversupplied by the end of 2025 and into 2026. Yet WTI prices have been unable to trade below $60.00.
The ongoing Russian-Ukrainian war continues to impact oil prices. While it is true that the world has adjusted to new trade flows, the situation has been complicated by new sanctions. President Trump looks to broker a deal to end the three-year war, but so far, those efforts have not brought the parties to the negotiating table, let alone resulted in a ceasefire. To add pressure on Russia, President Trump has imposed a 50% tariff on India as punishment for buying Russian oil.
The EU has introduced its own sanctions on entities doing business with Russian oil. New sanctions target all aspects of trade, including the companies managing shadow fleets, as well as traders of Russian crude. Bloomberg reports that both Saudi Aramco and Iraq’s state oil company has stopped selling crude to Nayara Energy refinery in India (Russia’s Rosneft has a 49% stake in Nayara).
Then there is the continued bombing campaign by Ukraine on Russia’s energy assets. An estimated 17% of Russian crude oil processing has been knocked offline by drone attacks.
With winter 2025-26 around the corner, diesel remains most vulnerable to price increases. East coast stocks remain low. European distillate stocks are also tight. Europe’s inability to rely on supply from India could shift supply from the U.S, creating an even tighter market for diesel.
The oil market is at a critical juncture. Prices for diesel and crude oil have been trading in narrow ranges with falling volume for most of August. Do not be lulled into a false sense of security. The market’s path forward will likely be a volatile one, with prices reflecting the winner of the tug-of-war between these conflicting realities.
Supply/Demand Balances
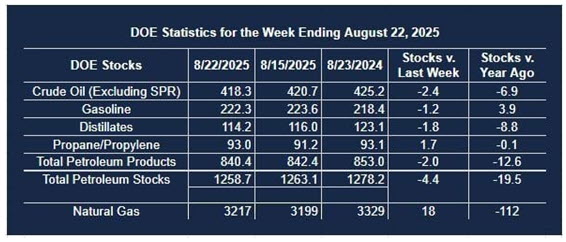
Supply/demand data in the United States for the week ending August 22, 2025, were released by the Energy Information Administration.
Total commercial stocks of petroleum decreased (⬇) 4.4 million barrels to 1.2587 billion barrels during the week ending August 22, 2025.
Commercial crude oil supplies in the United States were lower (⬇) by 2.4 million barrels from the previous report week to 418.3 million barrels.
Crude oil inventory changes by PAD District:
PADD 1: Down (⬇) 0.5 million barrels to 8.0 million barrels
PADD 2: Up (⬇) 0.4 million barrels to 103.7 million barrels
PADD 3: Down (⬇) 1.1 million barrels to 239.8 million barrels
PADD 4: Down (⬇) 0.5 million barrels to 21.9 million barrels
PADD 5: Up (⬆) 0.3 million barrels 45.0 million barrels
Cushing, Oklahoma, inventories were up (⬇) 0.9 million barrels to 22.6 million barrels.
Domestic crude oil production increased (⬆) 57,000 barrels per day from the previous report at 13.439 million barrels per day.
Crude oil imports averaged 6.234 million barrels per day, a daily decrease (⬇) of 263,000 barrels. Exports decreased (⬇) 562,000 barrels daily to 3.810 million barrels per day.
Refineries used 94.6% of capacity; a decrease (⬇) of 2.0 percent from the previous report week.
Crude oil inputs to refineries decreased (⬇) 328,000 barrels daily; there were 16.880 million barrels per day of crude oil run to facilities. Gross inputs, which include blending stocks, decreased (⬇) 359,000 barrels daily to 17.175 million barrels daily.
Total petroleum product inventories increased (⬇) by 2.0 million barrels from the previous report week, up to 840.4 million barrels.
Total product demand increased (⬆) 108,000 barrels daily to 21.614 million barrels per day.
Gasoline stocks decreased (⬇) 1.2 million barrels from the previous report week; total stocks are 222.3 million barrels.
Demand for gasoline increased (⬇) 398,000 barrels per day to 9.240 million barrels per day.
Distillate fuel oil stocks decreased (⬇) 1.6 million barrels from the previous report week; distillate stocks are at 114.2 million barrels. EIA reported national distillate demand at 4.141 million barrels per day during the report week, an increase (⬆) of 174,000 barrels daily.
Propane stocks rose (⬆) 1.7 million barrels from the previous report to 93.0 million barrels. The report estimated current demand at 954,000 barrels per day, an increase (⬆) of 130,000 barrels daily from the previous report week.
Natural Gas
Summer has been declared over in many parts of the U.S. Meteorologists at the Capital Weather Gang have never called the end of summer so early. “We can thank a persistent dip in the stream over eastern North America, which has promoted prevailing winds from north and northwest, for drawing refreshing air from Canada southward. That weather pattern isn’t forecasted to change in the next two weeks,” they reported at the end of August. The lack of late summer demand for cooling comes at a time of strong domestic production.
According to the EIA:
- Net injections into storage totaled 18 Bcf for the week ending August 22, compared with the five-year (2020–24) average net injections of 38 Bcf and last year’s net injections of 35 Bcf during the same week. Working natural gas stocks totaled 3,217 Bcf, which is 154 Bcf (5%) more than the five-year average and 112 Bcf (3%) lower than last year at this time.
- According to The Desk survey of natural gas analysts, estimates of the weekly net change to working natural gas stocks ranged from net injections of 19 Bcf to 38 Bcf, with a median estimate of 25 Bcf.
- The average rate of injections into storage is 18% higher than the five-year average so far in the refill season (April through October). If the rate of injections into storage matched the five-year average of 9.9 Bcf/d for the remainder of the refill season, the total inventory would be 3,907 Bcf on October 31, which is 154 Bcf higher than the five-year average of 3,753 Bcf for that time of year.
Was this helpful? We’d like your feedback.
Please respond to [email protected]
This material has been prepared by a sales or trading employee or agent of Powerhouse Brokers, LLC and is, or is in the nature of, a solicitation. This material is not a research report prepared by Powerhouse Brokers, LLC. By accepting this communication, you agree that you are an experienced user of the futures markets, capable of making independent trading decisions, and agree that you are not, and will not, rely solely on this communication in making trading decisions.
DISTRIBUTION IN SOME JURISDICTIONS MAY BE PROHIBITED OR RESTRICTED BY LAW. PERSONS IN POSSESSION OF THIS COMMUNICATION INDIRECTLY SHOULD INFORM THEMSELVES ABOUT AND OBSERVE ANY SUCH PROHIBITION OR RESTRICTIONS. TO THE EXTENT THAT YOU HAVE RECEIVED THIS COMMUNICATION INDIRECTLY AND SOLICITATIONS ARE PROHIBITED IN YOUR JURISDICTION WITHOUT REGISTRATION, THE MARKET COMMENTARY IN THIS COMMUNICATION SHOULD NOT BE CONSIDERED A SOLICITATION.
The risk of loss in trading futures and/or options is substantial and each investor and/or trader must consider whether this is a suitable investment. Past performance, whether actual or indicated by simulated historical tests of strategies, is not indicative of future results. Trading advice is based on information taken from trades and statistical services and other sources that Powerhouse Brokers, LLC believes are reliable. We do not guarantee that such information is accurate or complete and it should not be relied upon as such. Trading advice reflects our good faith judgment at a specific time and is subject to change without notice. There is no guarantee that the advice we give will result in profitable trades.
Copyright 2025 Powerhouse Brokers, LLC, All rights reserved