Oil Price Outlook Remains Bullish
- Weather events threaten supply/demand balances
- Global crude oil supply under pressure
- U.S. oil policy sends mixed messages
- Natural gas prices near seasonal entry point

The Matrix
Oil markets took profits as H. Florence’s intensity abated, however slightly. Products lost about five cents before stabilizing.
There remains much that continues to support prices and suggests a bullish outlook ahead. Global supply still faces uncertainty. Venezuela is struggling to sustain production. The potential loss of Iranian oil on November 4th adds another source of anxiety to market pricing.
The September edition of IEA’s Oil Market Report noted that Saudi Arabia and Iraq grew production 160,000 barrels per day in August. Sixty per cent of global spare capacity is held by Saudi Arabia. This crude oil may be available to offset other crude oil shortfalls, but questions remain about the ability to substitute Saudi oil for Venezuelan or Iranian supplies. And this comes at a time when global refining is operating at very high rates.
The U.S. Administration is pursuing a course with Iran that is bullish while encouraging expansion of domestic production and exports, a bearish tactic. It is ironic, since domestic output appears to have stalled around eleven million barrels per day. It is especially interesting in view of the prospect that higher energy prices may hit consumers in an election year.
Another bullish factor is the Energy Information Administration’s downward revision of global crude oil production in 2019. In the September 12th This Week in Petroleum, EIA said, “The increase in expected 2019 crude oil prices reflects a lower forecast for global oil supply in 2019 that is only partially offset by a lower forecast for oil demand next year.”
Supply/Demand Balances
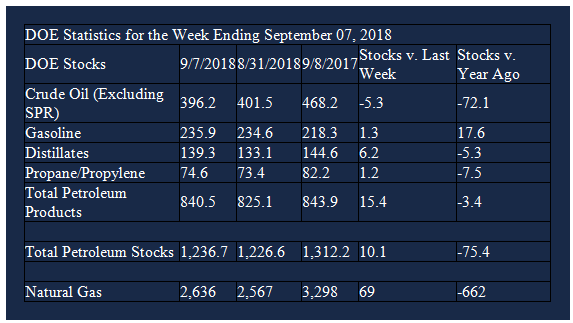
Supply/demand data in the United States for the week ending September 7, 2018 were released by the Energy Information Administration.
Total commercial stocks of petroleum rose 10.1 million barrels during the week ending September 7, 2018.
There were builds in stocks of gasoline, fuel ethanol, K-jet fuel, distillate fuel oil, residual fuel, propane, and other oils.
Commercial crude oil supplies in the United States decreased to 396.2 million barrels, a draw of 5.3 million barrels.
Crude oil supplies decreased in three of the five PAD Districts. PAD District 2 (Midwest) crude oil stocks fell 2.9 million barrels, PADD 3 (Gulf Coast) stocks declined 1.7 million barrels, and PADD 5 (West Coast) stocks retreated 0.6 million barrels. Crude oil stocks increased 0.3 million barrels in PADD 1 (East Coast) and rose 0.7 million barrels in PADD 4 (Rockies).
Cushing, Oklahoma inventories decreased 1.2 million barrels from the previous report week to 23.6 million barrels.
Domestic crude oil production decreased 100,000 barrels daily from the previous report week to 10.9 million barrels per day.
Crude oil imports averaged 7.591 million barrels per day, a daily decrease of 123,000 barrels per day. Exports increased 320,000 barrels daily to 1.828 million barrels per day.
Refineries used 97.6 per cent of capacity, an increase of 1.0 percentage points from the previous report week.
Crude oil inputs to refineries increased 210,000 barrels daily; there were 17.857 million barrels per day of crude oil run to facilities. Gross inputs, which include blending stocks, rose 187,000 barrels daily to 18.150 million barrels daily.
Total petroleum product inventories saw an increase of 15.4 million barrels from the previous report week.
Gasoline stocks increased 1.3 million barrels from the previous report week; total stocks are 235.9 million barrels.
Demand for gasoline decreased 84,000 barrels per day to 9.649 million barrels per day.
Total product demand decreased 1.092 million barrels daily to 20.570 million barrels per day.
Distillate fuel oil stocks increased 6.2 million barrels from the previous report week; distillate stocks are 139.3 million barrels. National distillate demand was reported at 3.288 million barrels per day during the report week. This was a weekly decrease of 1.003 million barrels daily.
Propane stocks rose 1.2 million barrels from the previous report week; propane stock are 74.6 million barrels. Current demand is estimated at 1.249 million barrels per day, an increase of 181,000 barrels daily from the previous report week.
Natural Gas
According to the Energy Information Administration:
Net injections are less than the five-year average. Net injections into storage totaled 69 Bcf for the week ending September 7, compared with the five-year (2013–17) average net injections of 74 Bcf and last year’s net injections of 87 Bcf during the same week. Working gas stocks totaled 2,636 Bcf, which is 596 Bcf lower than the five-year average and 662 Bcf lower than last year at this time.
Working gas stocks remain lower than the five-year range, and the deficit continues to grow. The average rate of net injections into storage is 16% lower than the five-year average so far in the 2018 refill season. If the rate of injections into working gas matches the five-year average of 10.8 Bcf/d for the remainder of the refill season, total inventories will be 3,219 Bcf on October 31, which is 341 Bcf lower than the five-year low of 3,560 Bcf.
Powerhouse’s David Thompson, CMT, has been tracking the winter ’18-’19 natural gas futures strip, seeking a likely purchase point. He says, in a note to clients, the strip is “bouncing off a well-defined support zone,” between $2.848 and $2.889. A typical 50% retracement of the strip’s recent sell-off would bring prices to $2.985.
The historical average seasonal price pattern for natural gas, shown below, tends to start a bottoming process. This causes us to become slightly more bullish as markets advance toward winter.

Natural Gas Futures Prices Seasonal Patter (2000 – 2017) Source: CME, Powerhouse
Futures trading involves significant risk and is not suitable for everyone. Transactions in securities futures, commodity and index futures and options on future markets carry a high degree of risk. The amount of initial margin is small relative to the value of the futures contract, meaning that transactions are heavily “leveraged”. A relatively small market movement will have a proportionately larger impact on the funds you have deposited or will have to deposit: this may work against you as well as for you. You may sustain a total loss of initial margin funds and any additional funds deposited with the clearing firm to maintain your position. If the market moves against your position or margin levels are increased, you may be called upon to pay substantial additional funds on short notice to maintain your position. If you fail to comply with a request for additional funds within the time prescribed, your position may be liquidated at a loss and you will be liable for any resulting deficit. Past performance may not be indicative of future results. This is not an offer to invest in any investment program.
Powerhouse is a registered affiliate of Coquest, Inc.
Was this helpful? We’d like your feedback.
Please respond to [email protected]
Copyright © 2018 Powerhouse, All rights reserved.