Window to Build Storage Closing as Winter Draws Near
- Propane prices rallying since April
- Propane arbitrage window drives prices
- Global events adding to bullishness in natural gas prices
Sincerely,
David Thompson, Executive Vice President
Elaine Levin, President
Powerhouse
(202) 333-5380
The Matrix
Mont Belvieu and Conway propane futures prices have been in a massive rally phase since mid-April. The cause of this rally has been simple fundamental factors. Strong domestic demand and strong exports have led to exceptionally low domestic inventory levels ahead of the upcoming high demand period.
The following chart shows the past seven years of U.S. propane inventory history. Comparable years (2017 and 2018) also saw strong price rallies heading into fall. It is critical to note that this year’s inventory levels are even lower than those years.
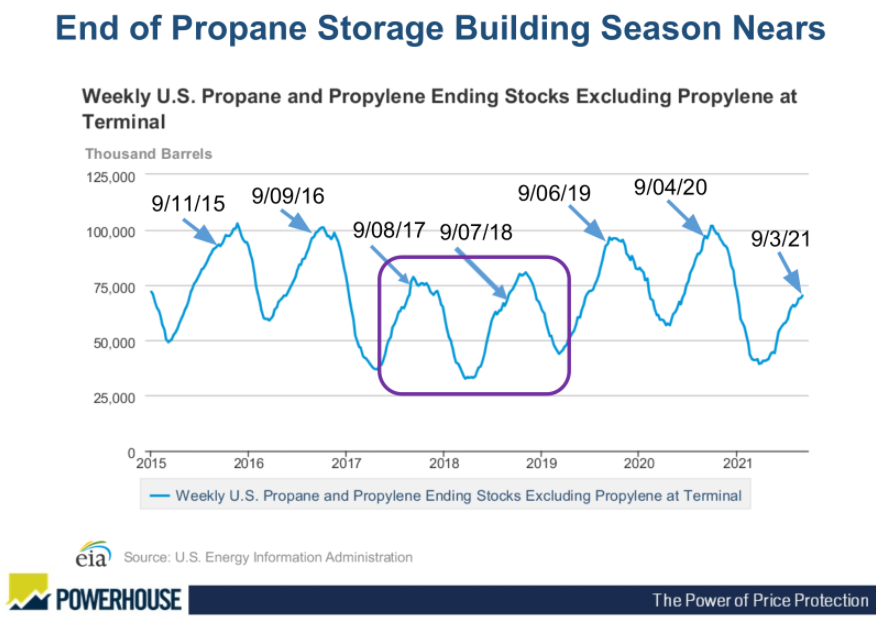
Propane Stocks (excluding Propylene) 2015 – 2021 Source: EIA
The arbitrage window to incentivize U.S. producers to ship propane to Asia is open.
The price difference between November 2021 as well as January 2022 OPIS Mont Belvieu futures and the corresponding Argus Propane Far East Index futures is currently over 21 cents per gallon.
These price differentials are more than enough to cover the cost of shipping to Asia.
U.S. Gulf Coast propane export capacity has increased significantly over the past five years. U.S. propane exports for the current four-week period are 31% higher than the same period in 2020 and 25% higher than in 2019.
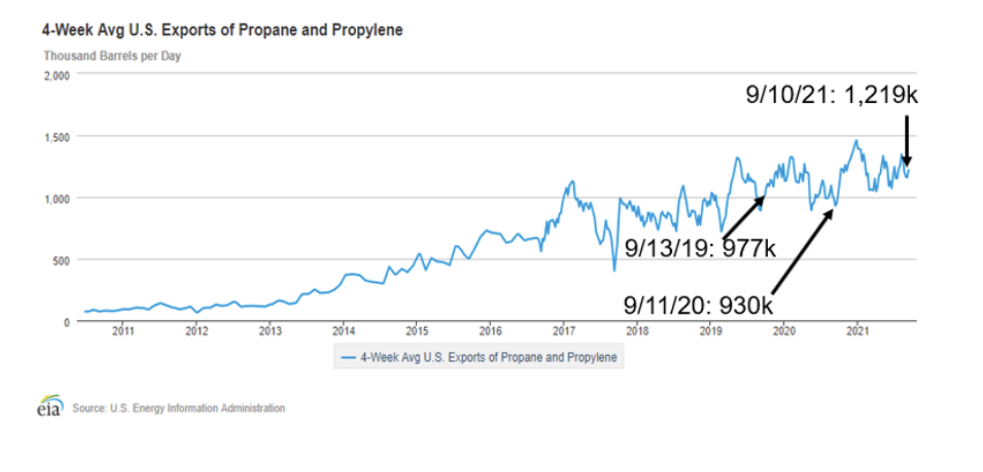
Propane Exports 4-Week Avg. 2010 – 2021 Source: EIA
Propane futures prices tend to top between mid-October and mid-November.
A warmer-than-expected start to the North American and North Asian winter season or less U.S. crop drying demand could stymie the current price rally. A significant ramp up in U.S. shale output with accompanying LPG production could also cause prices to stall.
The question facing market participants is whether the current market follows the path of 2018, and the rally comes to an end in October or do the extraordinarily low domestic inventories levels propel the price rally into November as occurred in 2017.
Our current view is that if the arbitrage window to Asia remains open, bullish price behavior will continue to dominate.
Supply/Demand Balances
Supply/demand data in the United States for the week ended Sept. 10, 2021, were released by the Energy Information Administration.
Total commercial stocks of petroleum fell 8.8 million barrels during the week ended Sept. 10, 2021.
Commercial crude oil supplies in the United States decreased by 6.4 million barrels from the previous report week to 417.4 million barrels.
Crude oil inventory changes by PAD District:
PADD 1: Plus at 0.2 million barrels
PADD 2: Down 3.2 million barrels to 113.9 million barrels
PADD 3: Down 3.8 million barrels to 224.2 million barrels
PADD 4: Down 0.1 million barrels to 23.4 million barrels
PADD 5: Plus 1.0 million barrels to 47.9 million barrels
Cushing, Oklahoma, inventories were down 1.1 million barrels from the previous report week to 35.3 million barrels.
Domestic crude oil production was up 100,000 barrels per day from the previous report week to 10.1 million barrels daily.
Crude oil imports averaged 5.761 million barrels per day, a daily decrease of 48,000 barrels. Exports increased 282,000 barrels daily to 2.624 million barrels per day.
Refineries used 82.1% of capacity; 0.3 percentage points higher from the previous report week.
Crude oil inputs to refineries increased 85,000 barrels daily; there were 14.387 million barrels per day of crude oil run to facilities. Gross inputs, which include blending stocks, rose 41,000 barrels daily to 14.886 million barrels daily.
Total petroleum product inventories fell 2.4 million barrels from the previous report week.
Gasoline stocks decreased 1.9 from the previous report week; total stocks are 218.1 million barrels.
Demand for gasoline fell 716,000 barrels per day to 8.892 million barrels per day.
Total product demand decreased 43,000 barrels daily to 19.911 million barrels per day.
Distillate fuel oil stocks fell 1.7 million barrels from the previous report week; distillate stocks are at 131.9 million barrels. EIA reported national distillate demand at 3.795 million barrels per day during the report week, an increase of 110,000 barrels daily.
Propane stocks rose 0.7 million barrels from the previous report week; propane stocks are at 70.8 million barrels. The report estimated current demand at 888,000 barrels per day, an increase of 27,000 barrels daily from the previous report week.
Natural Gas
Petroleum traders have learned that events a continent away can influence the price at home. Over the past few years, POWERHOUSE has commented that a global marketplace for oil is a cautionary tale to natural gas buyers and sellers. LNG now accounts for approximately 15% of the world’s gas consumption. With more and more natural gas leaving our shores, we can no longer look solely at North American supply and demand to determine what is influencing the price of gas in Henry Hub.
Despite the gradual return of production in the aftermath of Hurricane Ida, natural gas prices remain strong. Coal production in China is down. Drought in South American has reduced the production of hydropower. Russia has slowed exports of natural gas to Europe at a time when the lack of offshore wind has depressed electric generation. These events have slowed injections to storage both here and abroad. European natural gas inventories are particularly worrisome.
Just like propane, the time for adding to inventory is growing short, adding to the risk of higher prices as we head into winter in the Northern Hemisphere.
According to the EIA:
Working gas in storage was 3,006 Bcf as of Friday, September 10, 2021, according to EIA estimates. This represents a net increase of 83 Bcf from the previous week. Stocks were 595 Bcf less than last year at this time and 231 Bcf below the five-year average of 3,237 Bcf. At 3,006 Bcf, total working gas is within the five-year historical range.
Was this helpful? We’d like your feedback.
Please respond to [email protected]
Powerhouse Futures & Trading Disclaimer
Copyright 2021 Powerhouse Brokerage, LLC, All rights reserved