Markets Put Saudi Attack in Rear View Mirror
- WTI crude oil tests support at $50
- WTI inventories slowly shrinking
- Distillate fuel oil stocks tight
- Natural gas supplies 465 Bcf more than last year

The Matrix
The attack on Saudi Arabian oil processing facilities – only three weeks ago – became a one-day phenomenon with no follow-through to move prices higher. Indeed, Saudi production has approached ten million barrels daily most recently. Few bullish factors appear to be moving the markets.
Crude oil futures prices surged as markets opened following the attack. They rapidly backed off. Prices of WTI crude oil lost over twelve dollars from the post-attack high by Thursday, October 3rd. A relief rally developed with little suggestion of any more behind it than profit-taking.
Chart support around $50 continues to hold as it has since October 2017 (excepting a brief dip to $43.35 as 2018 ended.) One reason for price support holding may be found in slowly eroding U.S. crude oil inventories. EIA put commercial crude oil stocks at 423 million barrels for the week ending September 27th, about the same as the five -year average.
The drop in crude oil supply reflects several factors, including intense use of refinery facilities during the summer. At its peak, the utilization of refineries reached 96.1 percent of capacity at the end of July. Refining has since backed off; 86.4 percent of facilities are now in operation. Autumn refinery turnarounds that change the product mix, adding to distillate fuel oil capacity at the expense of gasoline, are in train.

Average US Distillate Exports 2010 – 2019 source: EIA
Distillate fuel oil stocks are in short supply. United States’ supplies have been running under the five-year average since at least the start of 2018. Inventories are now approaching the five-year minimum level. A new demand for distillate fuel oil is the imposition of Very Low Sulfur Fuel Oil (VLSFO) requirements on ocean vessels, estimated by some as running 1.5 million barrels daily. The United States continues to be an important supplier of distillate fuel oil to export markets. Exports have been trending higher since late 2017. And with early forecasts of a cold, wet winter, heating oil crack spreads may be an attractive structure.
Supply/Demand Balances
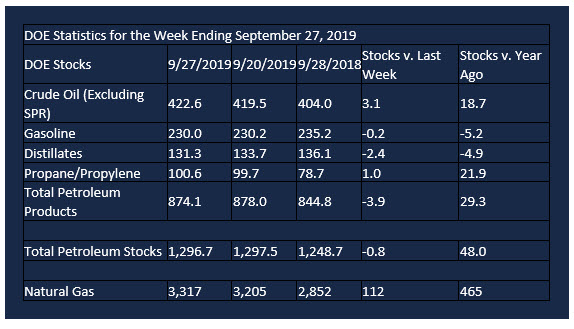
Supply/demand data in the United States for the week ending September 27, 2019, were released by the Energy Information Administration.
Total commercial stocks of petroleum fell by 0.9 million barrels during the week ending Sept. 27, 2019.
Commercial crude oil supplies in the United States increased 3.1 million barrels from the previous report week to 422.6 million barrels.
Crude oil inventory changes by PAD District:
PADD 1: Plus 0.6 million barrels to 11.8 million barrels
PADD 2: Plus 2.2 million barrels to 127.5 million barrels
PADD 3: Minus 0.7 million barrels to 215.8 million barrels
PADD 4: UNCH from previous report week at 20.4 million barrels.
PADD 5: Plus 1.2 million barrels to 47.3 million barrels
Cushing, Oklahoma inventories fell 0.2 million barrels from the previous report week to 40.7 million barrels.
Domestic crude oil production fell 100,000 daily from the previous report week to 12.4 million barrels per day.
Crude oil imports averaged 6.291 million barrels per day, a daily decrease of 87,000 barrels. Exports fell 116,000 barrels daily to 2.867 million barrels per day.
Refineries used 86.4 percent of capacity, down 3.4% from the previous report week.
Crude oil inputs to refineries decreased 496,000 barrels daily; there were 16.017 million barrels per day of crude oil run to facilities. Gross inputs, which include blending stocks, fell 636,000 barrels daily to reach 16.252 million barrels daily.
Total petroleum product inventories fell 4.0 million barrels from the previous report week.
Gasoline stocks decreased 0.2 million barrels daily from the previous report week; total stocks are 230.0 million barrels.
Demand for gasoline fell 209,000 barrels per day to 9.137 million barrels per day.
Total product demand decreased 430,000 barrels daily to 20.751 million barrels per day.
Distillate fuel oil stocks decreased 2.4 million barrels from the previous report week; distillate stocks are at 131.3 million barrels. EIA reported national distillate demand at 3.960 million barrels per day during the report week, an increase of 63,000 barrels daily.
Propane stocks increased 1.0 million barrels from the previous report week; propane stocks are 100.6 million barrels. The report estimated current demand at 1.124 barrels per day, a decrease of 333,000 barrels daily from the previous report week.
Natural Gas
Natural gas traded in sympathy with liquids in response to the military action in Saudi Arabia. Prices fell rapidly after testing a high of $2.70, bottoming around $2.21 before a short-lived relief rally. Prices since are trading in uncertain conditions.
According to the Energy Information Administration:
Net injections into storage totaled 112 Bcf for the week ending September 27, compared with the five-year (2014–18) average net injections of 83 Bcf and last year’s net injections of 91 Bcf during the same week. Working gas stocks totaled 3,317 Bcf, which is 18 Bcf lower than the five-year average and 465 Bcf more than last year at this time.
The average rate of net injections into storage is 28% higher than the five-year average so far in the refill season (April through October). If the rate of injections into storage matched the five-year average of 10.5 Bcf/d for the remainder of the refill season, total inventories would be 3,674 Bcf on October 31, which is 18 Bcf lower than the five-year average of 3,692 Bcf for that time of year.
Futures trading involves significant risk and is not suitable for everyone. Transactions in securities futures, commodity and index futures and options on future markets carry a high degree of risk. The amount of initial margin is small relative to the value of the futures contract, meaning that transactions are heavily “leveraged”. A relatively small market movement will have a proportionately larger impact on the funds you have deposited or will have to deposit: this may work against you as well as for you. You may sustain a total loss of initial margin funds and any additional funds deposited with the clearing firm to maintain your position. If the market moves against your position or margin levels are increased, you may be called upon to pay substantial additional funds on short notice to maintain your position. If you fail to comply with a request for additional funds within the time prescribed, your position may be liquidated at a loss and you will be liable for any resulting deficit. Past performance may not be indicative of future results. This is not an offer to invest in any investment program.
Powerhouse is a registered affiliate of Coquest, Inc.
Was this memo helpful? We’d like your feedback.
Please respond to [email protected]
Copyright© 2019 Powerhouse, All rights reserved.