Long-term Cycle Effects on Global Energy Production
- Longer term shifts in production are driven by larger macro trends
- Technology and geopolitics often play major roles
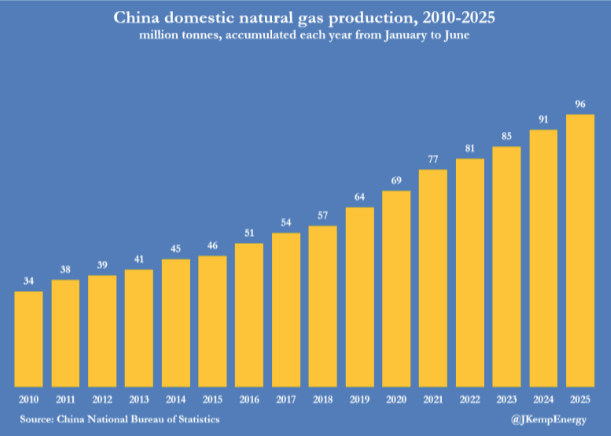
- China has incentivized domestic natural gas production
- Some natural gas prices in Canada turn negative
Sincerely,
David Thompson, CMT
Executive Vice President
Powerhouse
(202) 333-5380
The Matrix
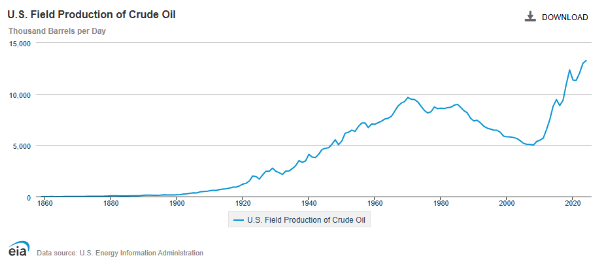
The development of new crude oil and natural gas production requires massive amounts of capital and long lead times. For this reason, significant changes are usually driven by demographics, geopolitics, technology or longer-term economic growth (or decline) as opposed to simple daily or weekly price fluctuations.
The rollercoaster ride that is the history of crude oil production in the United States dramatically illustrates this point. Declining through the better part of two decades (1985 – 2005) as cheaper-to-produce crude oil came onstream from other countries, the technological advances of the Shale Revolution launched one of the greatest comebacks in the history of energy production.
Something similar in scale is ongoing in China but in natural gas. China is the world’s largest importer of natural gas. It depended on imports to meet 43% of its total consumption in 2024. Recognizing this as a major geopolitical risk, Chinese policy decisions are prioritizing the growth of domestic shale gas production. Whereas the
U.S. increased crude oil production by 160% in twenty years (2005-25), China has increased its natural gas production by 182% over the last fifteen years (2010-25).
As data center demand for natural gas-fired power demand ramps up, the market should pay close attention to China’s efforts to ‘de-risk’ its exposure to natural gas imports.
Supply/Demand Balances
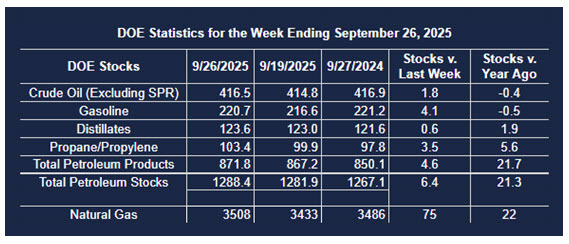
Supply/demand data in the United States for the week ended September 26, 2025, were released by the Energy Information Administration.
Total commercial stocks of petroleum increased (⬆) 7.2 million barrels to 1.2884 billion barrels during the week ended September 26th, 2025.
Commercial crude oil supplies in the United States were higher (⬆) by 1.8 million barrels from the previous report week to 416.5 million barrels.
Crude oil inventory changes by PAD District:
PADD 1: Down (⬇) 1.0 million barrels to 7.0 million barrels
PADD 2: Down (⬇) 1.6 million barrels to 101.6 million barrels
PADD 3: Up (⬆) 4.0 million barrels to 238.3 million barrels
PADD 4: Up (⬆) 0.1 million barrels to 22.8 million barrels
PADD 5: Up (⬆) 0.3 million barrels to 46.8 million barrels
Cushing, Oklahoma, inventories were down (⬇) 0.2 million barrels to 23.5 million barrels.
Domestic crude oil production increased (⬆) 4,000 barrels per day from the previous report to 13.505 million barrels per day.
Crude oil imports averaged 5.833 million barrels per day, a daily decrease (⬇) of 662,000 barrels. Exports decreased (⬇) 733,000 barrels daily to 3.751 million barrels per day.
Refineries used 91.4 percent of capacity; a decrease (⬇) of 1.6 percent from the previous report week.
Crude oil inputs to refineries decreased (⬇) 308,000 barrels daily; there were 16.168 million barrels per day of crude oil run to facilities. Gross inputs, which include blending stocks, decreased (⬇) 282,000 barrels daily to 16.604 million barrels daily.
Total petroleum product inventories increased (⬆) by 4.1 million barrels from the previous report week, up to 871.9 million barrels.
Total product demand decreased (⬇) 627,000 barrels daily to 20.166 million barrels per day.
Gasoline stocks increased (⬆) 4.1 million barrels from the previous report week; total stocks are 220.7 million barrels.
Demand for gasoline decreased (⬇) 440,000 barrels per day to 8.518 million barrels per day.
Distillate fuel oil stocks increased (⬆) 0.6 million barrels from the previous report week; distillate stocks are at 123.6 million barrels. EIA reported national distillate demand at 3.617 million barrels per day during the report week, a decrease (⬇) of 121,000 barrels daily.
Propane stocks rose (⬆) 3.5 million barrels from the previous report to 103.4 million barrels. The report estimated current demand at 534,000 barrels per day, a decrease (⬇) of 361,000 barrels daily from the previous report week.
Natural Gas
Over the last full week of September, cash natural gas prices at three major Canadian hubs (AECO, Westcoast Station 2 and Empress) all averaged negative values. A robust production response to the commissioning of LNG Canada’s new export facility has collided with the terminal’s inability to ramp up to full capacity leading to supply backups. Tariff effects and maintenance of some pipeline systems that export gas to the U.S. have also added to the downward pressure on Canadian prices.
According to the EIA:
- Net injections into storage totaled 53 Bcf for the week ended September 26, compared with the five-year (2020–24) average net injections of 85 Bcf and last year’s net injections of 54 Bcf during the same week. Working natural gas stocks totaled 3,561 Bcf, which is 171 Bcf (5%) more than the five-year average and 21 Bcf (1%) more than last year at this time.
- The average rate of injections into storage is 15% higher than the five-year average so far in the refill season (April through October). If the rate of injections into storage matched the five-year average of 10.4 Bcf/d for the remainder of the refill season, the total inventory would be 3,924 Bcf on October 31, which is 171 Bcf higher than the five-year average of 3,753 Bcf for that time of year.
Was this helpful? We’d like your feedback.
Please respond to [email protected]
This material has been prepared by a sales or trading employee or agent of Powerhouse Brokers, LLC and is, or is in the nature of, a solicitation. This material is not a research report prepared by Powerhouse Brokers, LLC. By accepting this communication, you agree that you are an experienced user of the futures markets, capable of making independent trading decisions, and agree that you are not, and will not, rely solely on this communication in making trading decisions.
DISTRIBUTION IN SOME JURISDICTIONS MAY BE PROHIBITED OR RESTRICTED BY LAW. PERSONS IN POSSESSION OF THIS COMMUNICATION INDIRECTLY SHOULD INFORM THEMSELVES ABOUT AND OBSERVE ANY SUCH PROHIBITION OR RESTRICTIONS. TO THE EXTENT THAT YOU HAVE RECEIVED THIS COMMUNICATION INDIRECTLY AND SOLICITATIONS ARE PROHIBITED IN YOUR JURISDICTION WITHOUT REGISTRATION, THE MARKET COMMENTARY IN THIS COMMUNICATION SHOULD NOT BE CONSIDERED A SOLICITATION.
The risk of loss in trading futures and/or options is substantial and each investor and/or trader must consider whether this is a suitable investment. Past performance, whether actual or indicated by simulated historical tests of strategies, is not indicative of future results. Trading advice is based on information taken from trades and statistical services and other sources that Powerhouse Brokers, LLC believes are reliable. We do not guarantee that such information is accurate or complete and it should not be relied upon as such. Trading advice reflects our good faith judgment at a specific time and is subject to change without notice. There is no guarantee that the advice we give will result in profitable trades.
Copyright 2025 Powerhouse Brokers, LLC, All rights reserved