Gasoline Drives Headlines; Diesel Drives Trucks
- Distillate fuel oil supply very tight
- Twenty-five days’ supply of distillate fuel now available.
- No immediate sign of price topping
- Natural gas prices could move under $4.00
Sincerely,
Alan Levine, Chairman
Powerhouse
(202) 333-5380
The Matrix
Gasoline drives headlines; diesel drives trucks. After a year of remarkable global uncertainty, the petroleum situation in the United States is coming down to the availability of distillate fuel oil this winter.
Inflation, employment and national policies are critical components when assessing the possible direction of our economy. But the condition of oil supply measured against demand hits much closer to home for those in the oil industry and its customers.

The importance of distillate fuels to the health of the economy cannot be understated. Uncertain supply in the months ahead have pushed spot distillate futures higher.
This was especially notable in that WTI spot futures showed only small gains, reflecting new crude oil supply from the SPR. The new supply added to domestic stocks (2.6 million barrels for the week ended October 21) but more to crude oil exports that rose to 5.2 million barrels per day, a weekly gain of nearly one million daily barrels. One year ago, at this time, crude exports were 2.8 million barrels per day.
On October 21, distillate fuel oil futures bottomed at $3.66. They reached $4.68 just five trading sessions later on Friday, October 28.
The gain reflected concern over the performance of the industry in accumulating distillate fuels while crude oil feedstock was comfortable. Refinery output fell nationally to 88.9% while East Coast facilities ran at 102.5% of capacity.
The market is left with only 106.4 million barrels in storage. This is slightly higher than 25 days’ supply. A colder winter could prove very challenging. This supply level is marginally above the 100 million barrel “minimum operating level” assumed necessary by many petroleum engineers for efficient operation of mid- and downstream activities of the industry.
There is no immediate sign of price topping. Elliott Wave analysis offers a possible pullback to $3.75, but only as a precursor to $4.80 or even $5.50.
Supply/Demand Balances
Supply/demand data in the United States for the week ended October 21, 2022, were released by the Energy Information Administration.
Total commercial stocks of petroleum fell 1.7 million barrels during the week ended October 21, 2022.
Commercial crude oil supplies in the United States increased by 2.6 million barrels from the previous report week to 439.9 million barrels.
Crude oil inventory changes by PAD District:
PADD 1: Down 0.7 million barrels to 7.9 million barrels
PADD 2: Plus 0.8 million barrels to 110.3 million barrels
PADD 3: Plus 1.8 million barrels to 249.5 million barrels
PADD 4: Down 0.3 million barrels to 23.4 million barrels
PADD 5: Plus 0.9 million barrels to 48.8 million barrels
Cushing, Oklahoma, inventories were up 0.7 million barrels from the previous report week to 26.9 million barrels.
Domestic crude oil production was unchanged from the previous report week at 12 million barrels daily.
Crude oil imports averaged 6.180 million barrels per day, a daily increase of 273,000 barrels. Exports increased 991,000 barrels daily to 5.129 million barrels per day.
Refineries used 88.9% of capacity; 0.6 percentage points lower than the previous report week.
Crude oil inputs to refineries decreased 114,000 barrels daily; there were 15.436 million barrels per day of crude oil run to facilities. Gross inputs, which include blending stocks, fell 115,000 barrels daily to 15.965 million barrels daily.
Total petroleum product inventories dropped by 4.2 million barrels from the previous report week, falling to 784.9 million barrels.
Total product demand decreased 174,000 barrels daily to 20.587 million barrels per day.
Gasoline stocks decreased 1.5 million barrels from the previous report week; total stocks are 207.9 million barrels.
Demand for gasoline increased 253,000 barrels per day to 8.93 million barrels per day.
Distillate fuel oil stocks increased 0.2 million barrels from the previous report week; distillate stocks are at 106.4 million barrels. EIA reported national distillate demand at 3.878 million barrels per day during the report week, a decrease of 194,000 barrels daily.
Propane stocks increased by 0.9 million barrels from the previous report week to 86.8 million barrels. The report estimated current demand at 720,000 barrels per day, a decrease of 766,000 barrels daily from the previous report week.
Natural Gas
Natural gas markets have dealt with several very dynamic events in the past several months. The European Union has been seeking to reduce the influence of Russian natural gas on regional supply. The Nord Stream pipeline has suffered sabotage. LNG exports from Freeport, LA have been cut by an accident at the plant.
Prices confirmed this, rising to $9.68 in late August. Since then, however, efforts to supply the EU have borne fruit. Spot Henry Hub natural gas futures prices have cut deeply into that rally, falling to $4.75 in trading on October 24. Prices settled last week at $5.68.
The pull from European countries has attracted so many cargoes that prices are under pressure again. LNG tankers cannot unload fast enough at southern European ports, where infrastructure is unable to deal with heightened offloading pressure. (Higher prices attracted so much natural gas earlier this year that storage in Europe is estimated to be 93% full.)
Sixty vessels have been reported slow steaming around northwest Europe, the Mediterranean Sea, and the Iberian Peninsula, waiting to unload. This has backed up exports from the United States, adding to downward price pressure here in America.
Elliott Wave analysis suggests a dip towards $3.20 this winter.
According to the EIA:
Net [natural gas] injections into storage totaled 52 Bcf for the week ended October 21, compared with the five-year (2017–2021) average net injections of 66 Bcf and last year’s net injections of 88 Bcf during the same week. Working natural gas stocks totaled 3,394 Bcf, which is 197 Bcf (5%) lower than the five-year average and 142 Bcf (4%) lower than last year at this time.
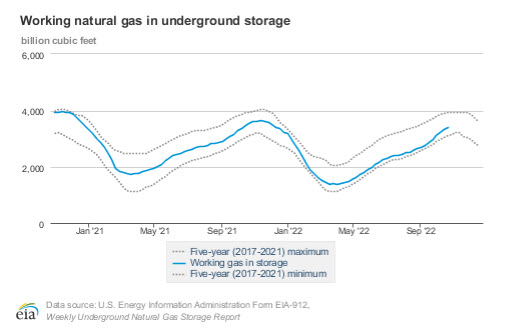
The average rate of injections into storage is 4% higher than the five-year average so far in the refill season (April through October). If the rate of injections into storage matched the five-year average of 5.4 Bcf/d for the remainder of the refill season, the total inventory would be 3,448 Bcf on October 31, which is 197 Bcf lower than the five-year average of 3,645 Bcf for that time of year.
Was this helpful? We’d like your feedback.
Please respond to [email protected]
Powerhouse Futures & Trading Disclaimer
Copyright 2022 Powerhouse Brokerage, LLC, All rights reserved