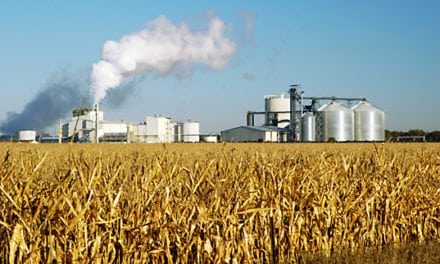
Oil Prices Balancing Expected Refinery Rate Recovery and Global Political Tensions
- Refinery turnaround nears peak; full recovery mid-November
- Iran crude exports set to be curtailed in early November
- Producer agreement to replace supply lost from Iran, Venezuela etc. not fulfilled
- East Coast natural gas delivery to improve as two new pipelines come onstream from Marcellus and Utica Basins

The Matrix
ULSD prices have retreated to the earlier resistance level of $2.3080, reflecting in part modest growth in US crude oil inventories. They are currently standing around the five-year average for domestic crude oil supplies.
One reason for the increase in crude oil stocks is the refinery turnaround situation. After operating near full capacity for several weeks, facilities use retreated, working at 88.8 per cent of capacity. This has supported product prices and limited gains in crude oil valuations.
One analysis estimates, however, that repair work, now keeping about 1.5-1.7 million barrels daily of productive capacity off line will soon be complete with refiners fully recovered by mid-November. This should be seen in weaker crack spreads as product supply and crude oil demand grow.
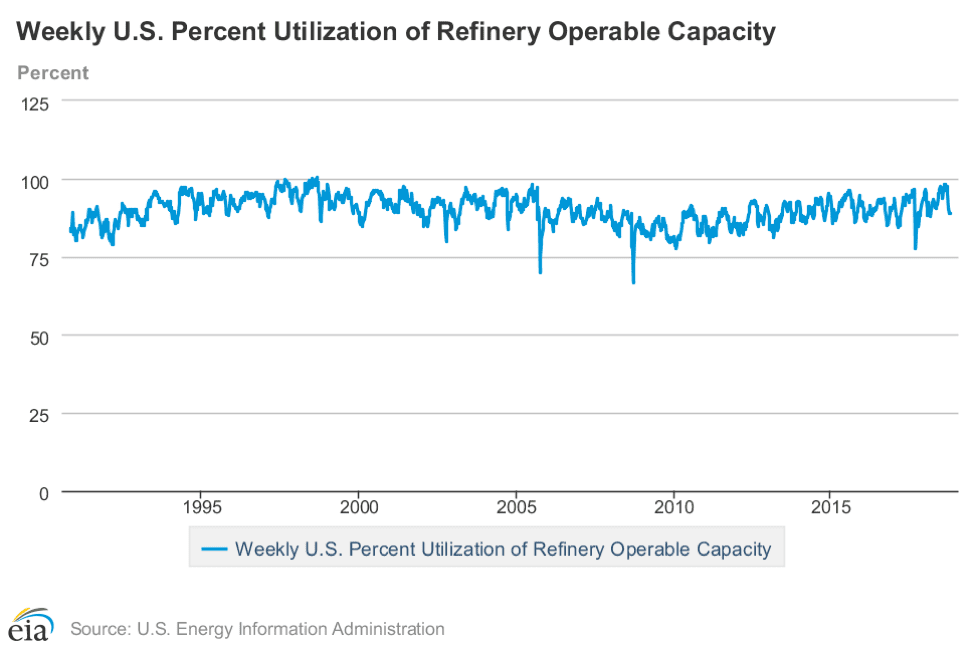
Percent Refinery Utilization 1990 – 2018 Source: EIA
This generally price-bearish scenario is occurring against a background of increasing international tensions. These include sanctions scheduled to begin in early November against Iran and growing international anger against the apparent murder of a Saudi journalist by agents of the Kingdom.
And this is occurring while Iranian crude oil is about to be constrained. Ironically, there is evidence that Saudi Arabia is near its near-term productive limit and might not be able to replace as much of any lost Iranian supply anyway.
This could result in significant increases in price. One analyst estimates a doubling of energy prices by year end with Brent now at four year highs and disruptions among other OPEC suppliers.
A June agreement among foreign producers to increase supply has yet to be fulfilled. A Saudi increase has been met by declines in Iran, Venezuela and Angola. An internal OPEC analysis showed a group increase in September of 428,000 barrels daily. And this excludes Nigeria, Libya and Congo.
Supply/Demand Balances
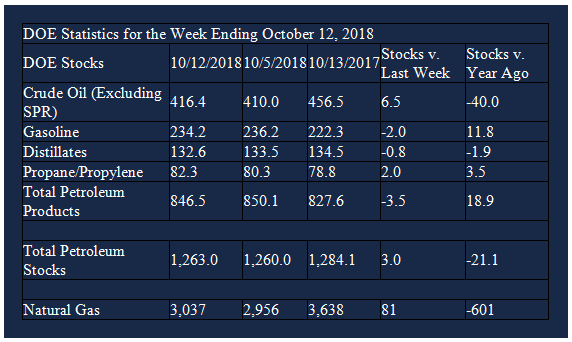
Supply/demand data in the United States for the week ending October 12, 2018 were released by the Energy Information Administration.
Total commercial stocks of petroleum rose 3.0 million barrels during the week ending October 12, 2018.
There were builds in stocks of fuel ethanol, residual fuel, and propane. There were draws reported in stocks of gasoline, K-jet fuel, distillates, and other oils.
Commercial crude oil supplies in the United States increased to 416.4 million barrels, a build of 6.5 million barrels.
Crude oil supplies increased in four of the five PAD Districts. PAD District 1 (East Coast) stocks rose 1.6 million barrels, PADD 2 (Midwest) stocks increased 2.2 million barrels, PADD 3 (Gulf Coast) stocks were up 1.0 million barrels, and PADD 5 (west Coast) stocks gained 1.6 million barrels. PADD 4 (Rockies) stocks were unchanged from the previous report week.
Cushing, Oklahoma inventories increased 1.7 million barrels from the previous report week to 28.6 million barrels.
Domestic crude oil production was down 300,000 barrels daily from the previous report week to 10.9 million barrels per day.
Crude oil imports averaged 7.615 million barrels per day, a daily increase of 218,000 barrels per day. Exports decreased 794,000 barrels daily to 1.782 million barrels per day.
Refineries used 88.8 per cent of capacity, unchanged from the previous report week.
Crude oil inputs to refineries increased 77,000 barrels daily; there were 16.316 million barrels per day of crude oil run to facilities. Gross inputs, which include blending stocks, declined 5,000 barrels daily to 16.513 million barrels daily.
Total petroleum product inventories fell 3.5 million barrels from the previous report week.
Gasoline stocks decreased 2.0 million barrels from the previous report week; total stocks are 234.2 million barrels.
Demand for gasoline increased 105,000 barrels per day to 9.182 million barrels per day.
Total product demand increased 337,000 barrels daily to 19.960 million barrels per day.
Distillate fuel oil stocks decreased 0.8 million barrels from the previous report week; distillate stocks are 132.6 million barrels. National distillate demand was reported at 3.793 million barrels per day during the report week. This was a weekly decrease of 836,000 barrels daily.
Propane stocks rose 2.0 million barrels from the previous report week; propane stock are 82.3 million barrels. Current demand is estimated at 0.862 million barrels per day, a decrease of 401,000 barrels daily from the previous report week.
Natural Gas
Natural gas supply in the northeast has been constrained by inadequate offtake capabilities – similar to the challenges facing crude oil from the Permian Basin. Access to markets will take a turn for the better as two new pipelines are place in service this month. New capacity in October is expected to be 1.85 billion cubic feet per day. This is part of the 3.2 billion cubic feet daily of new offtake capacity in Pennsylvania and Ohio set for fourth quarter, 2018.
Offtake availability should translate into expanded production of dry gas. EIA estimates with proposed 2018 projects, pipeline capacity by end 2018 will exceed 23 billion cubic feet per day. This is an annual gain of 5 billion cubic feet per day over last year.
According to the Energy Information Administration:
Net injections into storage totaled 81 Bcf for the week ending October 12, compared with the five-year (2013–17) average net injections of 79 Bcf and last year’s net injections of 55 Bcf during the same week. Working gas stocks totaled 3,037 Bcf, which is 605 Bcf lower than the five-year average and 601 Bcf lower than last year at this time.
The average rate of net injections into storage is 13% lower than the five-year average so far in the 2018 refill season (April through October). If the rate of injections into working gas matched the five-year average of 9.1 Bcf/d for the remainder of the refill season, total inventories would be 3,210 Bcf on October 31, which is 605 Bcf lower than the five-year average of 3,815 Bcf for that time of year.
Futures trading involves significant risk and is not suitable for everyone. Transactions in securities futures, commodity and index futures and options on future markets carry a high degree of risk. The amount of initial margin is small relative to the value of the futures contract, meaning that transactions are heavily “leveraged”. A relatively small market movement will have a proportionately larger impact on the funds you have deposited or will have to deposit: this may work against you as well as for you. You may sustain a total loss of initial margin funds and any additional funds deposited with the clearing firm to maintain your position. If the market moves against your position or margin levels are increased, you may be called upon to pay substantial additional funds on short notice to maintain your position. If you fail to comply with a request for additional funds within the time prescribed, your position may be liquidated at a loss and you will be liable for any resulting deficit. Past performance may not be indicative of future results. This is not an offer to invest in any investment program.
Powerhouse is a registered affiliate of Coquest, Inc.
Was this helpful? We’d like your feedback.
Please respond to [email protected]
Copyright © 2018 Powerhouse, All rights reserved