

Oil Prices Soften Despite Tight ULSD Supply and Global Uncertainty
- Global markets see uncertain future
- WTI crude oil spot futures lost ground
- ULSD supplies approaching minimum operating level
- Natural gas could begin winter with 3.4 Tcf in storage.
Sincerely,
Alan Levine, Chairman
Powerhouse
(202) 333-5380
The Matrix
Uncertainty abounds in global oil markets. The European Union is prepared to initiate significant limits on imports of Russian oil. Iran faces internal unrest not seen since perhaps the Revolution of 1979. Political calculations in the United States prior to a significant mid-term election could invite price/export controls on petroleum products leading to unintended market repercussions.
Oil prices on U.S. futures markets finished last week without a serious directional signal. ULSD ended the week on an inside day, (a lower high price and a higher low than the day before.) RBOB spot futures described a narrow, uninformative week.
WTI crude oil reached a new marginal low for the week. Prices finished at $85.61, holding support. Major support is well below, around $76.15. (ULSD nearby support is at $3.90, with $3.69, $3.50 and $3.12 below.
Prices weakening in light of global indecision seems counterintuitive. In the near-term, domestic inventory may help explain the ambiguity.

ULSD is the current focus of supply concern in the United States. EIA recorded 106.1 million barrels of distillate fuels on hand for the week ended October 7, 2022. This was extremely low, nearly as slim as in April, when stocks bottomed at 104 million barrels. The obvious difference being the beginning of the winter upon us.
RBOB stocks are also well below normal. Seasonal drops in demand and the continuing absence of Atlantic hurricane activity minimize the impact of low stocks this year. In fact, gasoline supply is above the minimum for the past five years.
Commercial crude oil supplies are more abundant. They are about average for this time of year, standing at 439 million barrels. This number, may overstate the reality.
The government has authorized releases from the SPR in recent years in support of national economic objectives. In June, 2020, SPR held 639 million barrels. Currently, there are 409 million barrels in the Reserve. The reduction represents a transfer of crude oil to the commercial market. It does not mean new oil from production or imports in support of availability.
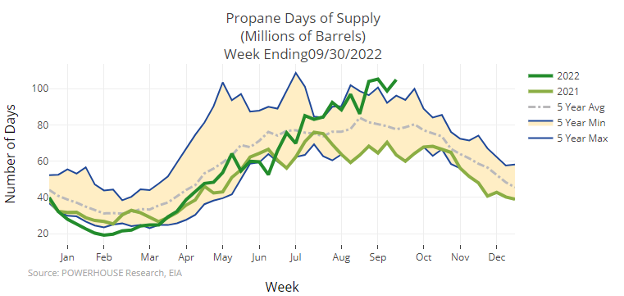
Propane does not seem to be a supply concern this winter. Stocks are at 302 million barrels, about normal for this time of year. There are more than 100 days’ of inventory in storge, higher than even the high average of the past five years.
Supply/Demand Balances
Supply/demand data in the United States for the week ended October 7, 2022, were released by the Energy Information Administration.
Total commercial stocks of petroleum rose 8.0 million barrels during the week ended October 7, 2022.
Commercial crude oil supplies in the United States increased by 9.9 million barrels from the previous report week to 439.1 million barrels.
Crude oil inventory changes by PAD District:
PADD 1: Unchanged at 8.1 million barrels
PADD 2: Down 0.8 million barrels to 109.4 million barrels
PADD 3: Up 8.3 million barrels to 249.1 million barrels
PADD 4: Up 0.5 million barrels to 23.6 million barrels
PADD 5: Up 1.9 million barrels to 48.8 million barrels
Cushing, Oklahoma inventories were down 0.4 million barrels from the previous report week to 25.6 million barrels.
Domestic crude oil production was down 100,000 from the previous report week at 11.9 million barrels daily.
Crude oil imports averaged 6.063 million barrels per day, a daily increase of 116,000 barrels. Exports decreased 1.679 million barrels daily to 2.872 million barrels per day.
Refineries used 89.9% of capacity; 1.4 percentage points lower than the previous report week.
Crude oil inputs to refineries decreased 279,000 barrels daily; there were 15.683 million barrels per day of crude oil run to facilities. Gross inputs, which include blending stocks, fell 241,000 barrels daily to 16.147 million barrels daily.
Total petroleum product inventories dropped by 1.9 million barrels from the previous report week, falling to 789.9 million barrels.
Total product demand decreased 1.560 million barrels daily to 19.271 million barrels per day.
Gasoline stocks increased 2 million barrels from the previous report week; total stocks are 209.5 million barrels.
Demand for gasoline decreased 1.189 million barrels per day to 8.276 million barrels per day.
Distillate fuel oil stocks decreased 4.9 million barrels from the previous report week; distillate stocks are at 106.1 million barrels. EIA reported national distillate demand at 4.37 million barrels per day during the report week, an increase of 265,000 barrels daily.
Propane stocks increased by 1.1 million barrels from the previous report week to 85.5 million barrels. The report estimated current demand at 895,000 barrels per day, a decrease of 35,000 barrels daily from the previous report week.
Natural Gas
Weather is turning seasonably cooler. The week ended October 6, 2022, recorded 45 HDDs, 28 more than last year. The Middle Atlantic and Northern-tier Central states were notably colder. Each had 51 HDDs more than last year.
This led to consumption of 2.1 Bcf/d natural gas for the week, 3.2% greater than during the prior week. The power sector experienced a 4.5 per cent gain, and residential/commercial demand gained 5.6% for the week.
Outflows to Mexico and to LNG export faculties lagged, reflecting continued facility problems in the Gulf Coast. Prices traded range-bound, still waiting for further action in the EU as plans for further embargo on Russian supply approach implementation later this year.
Hopes for new supplies from Iran appear to be fading as work stoppages mount. Efforts to end the sanctions regime in Iran ran into problems during recent negotiations.
According to the EIA:
The net injections into storage totaled 125 Bcf for the week ended October 7, compared with the five-year (2017–2021) average net injections of 82 Bcf and last year’s net injections of 86 Bcf during the same week. Working natural gas stocks totaled 3,231 Bcf, which is 221 Bcf (6%) lower than the five-year average and 126 Bcf (4%) lower than last year at this time.
The average rate of injections into storage is 3% higher than the five-year average so far in the refill season (April through October). If the rate of injections into storage matched the five-year average of 8.0 Bcf/d for the remainder of the refill season, the total inventory would be 3,424 Bcf on October 31, which is 221 Bcf lower than the five-year average of 3,645 Bcf for that time of year.
Was this helpful? We’d like your feedback.
Please respond to [email protected]
Powerhouse Futures & Trading Disclaimer
Copyright 2022 Powerhouse Brokerage, LLC, All rights reserved

