Volatile Oil Prices Reflect Unusual Range of Factors
- Price uncertainty depends on OPEC expanding/contracting crude oil supply
- Seasonal factors in play include crop drying moisture
- Higher prices deferred refinery maintenance. Utilization now at 88.8 per cent
- El Nino 65-70 per cent likelihood in winter 2018-19

The Matrix
Oil prices have undergone significant volatility in recent weeks. The volatility stems from a variety of factors. These include political implications of any decision by OPEC members with respect to continued production restraint or expansion of supply, uncertainty with respect to economics situations in Venezuela and Libya among others and the implications of traditional seasonal elements on petroleum supply/demand balances.
Seasonal elements occur regularly and contribute to volatility, but it is not possible to say the degree to which such factors might influence price. Temperature, measured in Heating Degree Days (HDD) is one such element. Others include the timing of agricultural activities like spring planting and fall harvest and their demand on diesel fuel. Crop drying is an autumn activity influencing demand for propane.
Another seasonal element reflects the management of refinery maintenance. Typically, refineries are subject to major maintenance in early autumn and later as winter tails off into spring. This year, attractive margins for refiners apparently led to deferral of maintenance and refineries ran at upwards of 95 per cent of capacity. U.S. refineries ran at 97.6 per cent of capacity as recently as the week ending September 7, 2018.
Subsequently, utilization has fallen to 88.8 per cent in the most recent EIA supply /demand balance of October 5, 2018. This is a recipe for expanding crack spreads – higher product prices because of pressure on gasoline and ULSD supplies and constrained crude oil prices as refiners reduce demand for feedstock.
In fact, oil prices fell sharply in response to steep selloffs in equity markets. This is another influence on prices. Prices may have tumbled, but the underlying concerns for global supply remain in play and are likely to support oil prices going forward.
Weather is always an interest to the oil trade. And this year, the El Nino phenomenon, a bearish factor for heating oil demand, is part of the outlook. NOAA, the National Oceanic and Atmospheric Administration, is tracking a developing El Nino. NOAA forecasts a 50-55 per cent chance of a weak El Nino developing during September-November 2018, increasing to 65-70 per cent chance during winter 2018-19. There are weather futures available to help protect against the impact of a warmer winter on profit margins.
Supply/Demand Balances
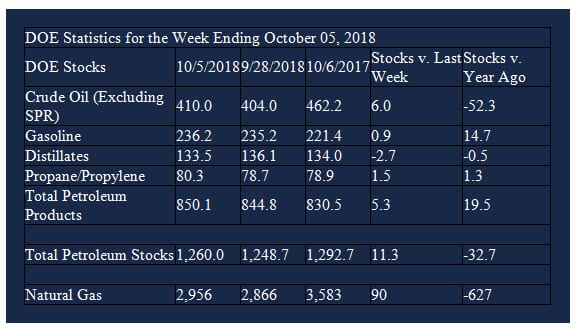
Supply/demand data in the United States for the week ending October 5, 2018 were released by the Energy Information Administration.
Total commercial stocks of petroleum rose 11.3 million barrels during the week ending October 5, 2018.
There were builds in stocks of gasoline, fuel ethanol, K-jet fuel, residual fuel, propane, and other oils. There was a draw in stocks of distillate fuel stocks.
Commercial crude oil supplies in the United States increased to 410.0 million barrels, a build of 6.0 million barrels.
Crude oil supplies increased in three of the five PAD Districts. PAD District 2 (Midwest) stocks rose 4.2 million barrels, PADD 3 (Gulf Coast) stocks were up 2.3 million barrels, and PADD 5 (west Coast) stocks gained 1.3 million barrels. PADD 1 (East Coast) stocks declined 1.5 million barrels and PADD 4 (Rockies) crude oil stocks decreased 0.4 million barrels
Cushing, Oklahoma inventories increased 2.4 million barrels from the previous report week to 26.9 million barrels.
Domestic crude oil production was up 100,000 barrels daily from the previous report week to 11.2 million barrels per day.
Crude oil imports averaged 7.397 million barrels per day, a daily decrease of 568,000 barrels per day. Exports increased 853,000 barrels daily to 2.576 million barrels per day.
Refineries used 88.8 per cent of capacity, a 1.6% decreased from the previous report week.
Crude oil inputs to refineries decreased 352,000 barrels daily; there were 16.239 million barrels per day of crude oil run to facilities. Gross inputs, which include blending stocks, declined 290,000 barrels daily to 16.518 million barrels daily.
Total petroleum product inventories built 6.6 million barrels from the previous report week.
Gasoline stocks increased 1.0 million barrels from the previous report week; total stocks are 236.2 million barrels.
Demand for gasoline decreased 24,000 barrels per day to 9.078 million barrels per day.
Total product demand decreased 351,000 barrels daily to 19.823 million barrels per day.
Distillate fuel oil stocks decreased 2.7 million barrels from the previous report week; distillate stocks are 133.5 million barrels. National distillate demand was reported at 4.629 million barrels per day during the report week. This was a weekly increase of 752,000 barrels daily.
Propane stocks rose 1.5 million barrels from the previous report week; propane stock are 80.3 million barrels. Current demand is estimated at 1.263 million barrels per day, an increase of 387,000 barrels daily from the previous report week.
Natural Gas
According to EIA:
EIA forecasts that natural gas inventories will reach 3,263 billion cubic feet (Bcf) at the end of October in its recently released October Short-Term Energy Outlook (STEO), the lowest end-of-October level for U.S. natural gas inventories since 2005. Lingering cold temperatures in April 2018, the coldest April in the past 21 years, delayed the start of the natural gas storage refill season by about four weeks. Coupled with heavy natural gas withdrawals in January 2018, the delayed start to the refill season led to storage levels that have remained lower than the previous five-year minimum. However, late-season injections during the past four weeks have been close to their five-year averages, with injections averaging 81 Bcf compared with the five-year average of 82 Bcf.
The Weekly Natural Gas Update notes:
Net injections into storage totaled 90 Bcf for the week ending October 5, which is the same as the five-year (2013–17) average net injections and higher than last year’s net injections (81 Bcf) during the same week. Working gas stocks totaled 2,956 Bcf, which is 607 Bcf lower than the five-year average and 627 Bcf lower than last year at this time.
Futures trading involves significant risk and is not suitable for everyone. Transactions in securities futures, commodity and index futures and options on future markets carry a high degree of risk. The amount of initial margin is small relative to the value of the futures contract, meaning that transactions are heavily “leveraged”. A relatively small market movement will have a proportionately larger impact on the funds you have deposited or will have to deposit: this may work against you as well as for you. You may sustain a total loss of initial margin funds and any additional funds deposited with the clearing firm to maintain your position. If the market moves against your position or margin levels are increased, you may be called upon to pay substantial additional funds on short notice to maintain your position. If you fail to comply with a request for additional funds within the time prescribed, your position may be liquidated at a loss and you will be liable for any resulting deficit. Past performance may not be indicative of future results. This is not an offer to invest in any investment program.
Powerhouse is a registered affiliate of Coquest, Inc.
Was this helpful? We’d like your feedback.
Please respond to [email protected]
Copyright © 2018 Powerhouse, All rights reserved.