Gasoline Demand Growth at Odds With Falling Traffic Volumes
- U.S. gasoline demand reaches new highs
- Gasoline prices softer since May
- Federal Highway Administration reports lower traffic volumes
- Natural gas injections lower than the 5-year average

The Matrix
Petroleum prices have moved higher this year because of expanded demand and serious concerns over crude oil supply. Gasoline demand in the United States reached new highs according to the EIA’s weekly Petroleum Balance Sheet notwithstanding considerable hype over emerging electric autos.
As a practical matter, electric vehicles (EV) have a way to go before they seriously impact demand for hydrocarbon-based gasoline. Supporting infrastructure—charging stations, storage batteries — is still hard to find.
Internal combustion remains the engine power of choice. That’s reflected in the 9.7 million barrels daily gasoline demand level recorded during the week ending September 14, 2018. And despite significant gasoline use as late as September, prices had softened since May. This reflected traditional summer gasoline price behavior and in September, the pricing of winter grade RBOB.
The Gasoline Index chart below shows the seasonal pattern of gasoline prices which has typically occurred since 2000. This year, prices have not followed that pattern. They topped normally in May at $2.2855 and after losing thirty-six cents by early September, recovered, trading now at $2.11.
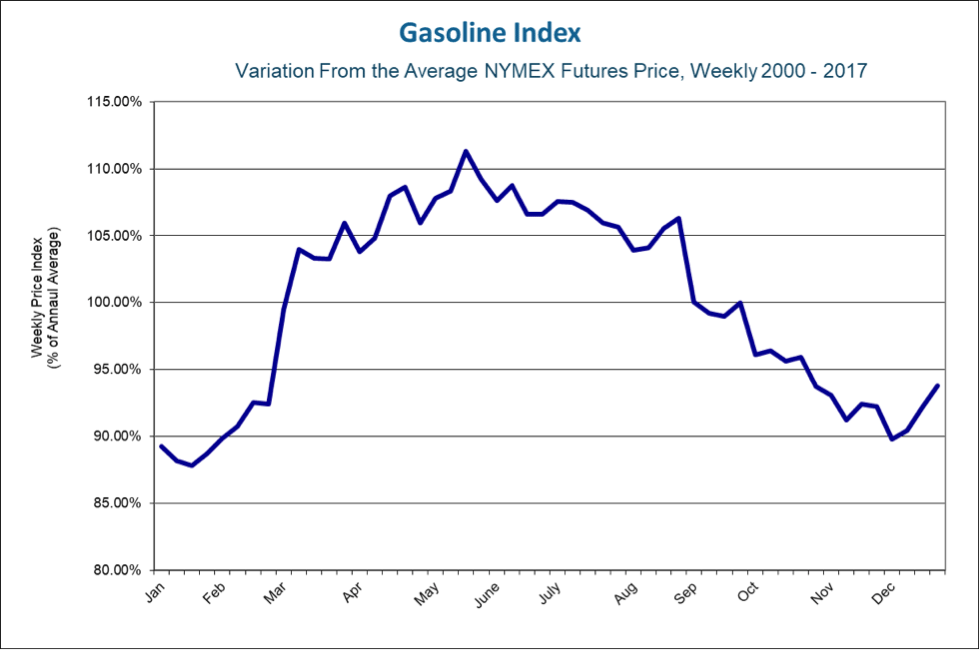
RB Seasonal Price Index 2000-2017 Source: CME, Powerhouse
The measure of gasoline demand presented in the weekly Balance is at odds with other consumption data produced by federal agencies. The Federal Highway Administration reported traffic volumes 0.3 per cent lower this July than last year. This was the second month of decline in traffic in 2018. The declines were the first since 2014.
FHA asserts a negative relationship between traffic volumes and gasoline prices. This may be intuitively attractive, but it stands in sharp contrast with record gasoline demand and rising oil prices.
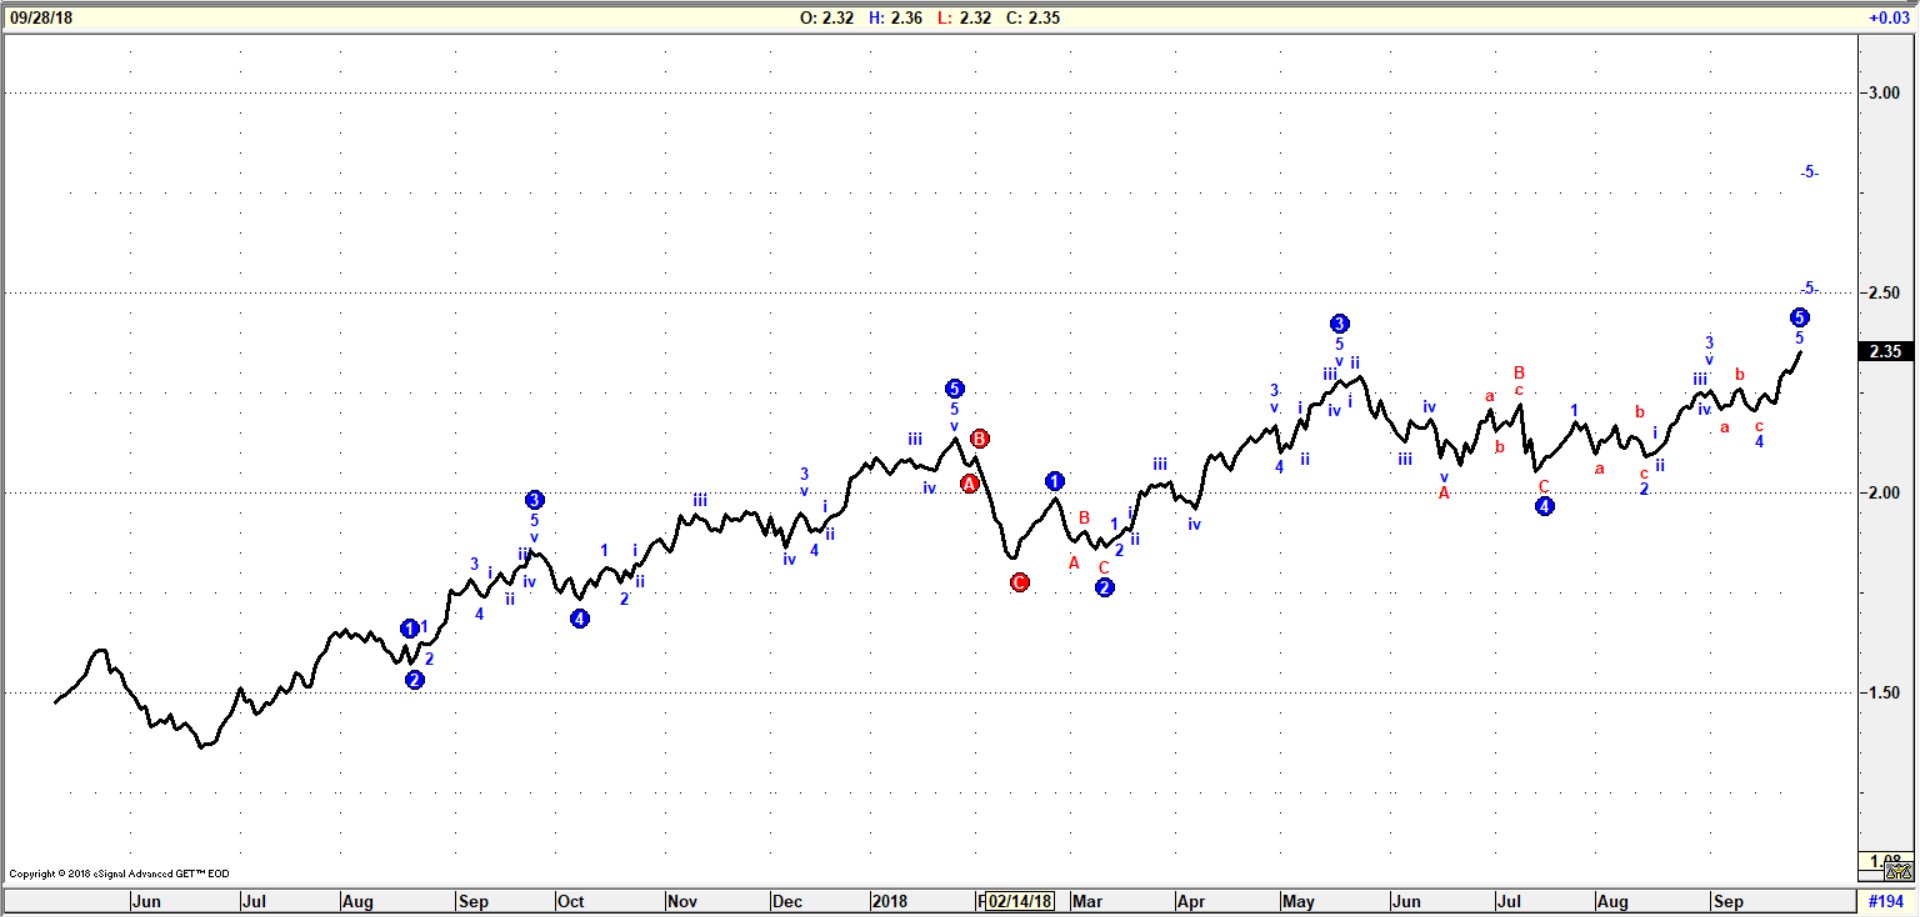
Technical analysis of petroleum product prices also supports the EIA’s bullish case. Notwithstanding lowering traffic volume, chart analysis of gasoline projects $2.36. Spot futures are now trading at $2.1150.

RBOB Continuation Chart as of Sept. 28, 2018 Source: CME
Price charts of ULSD are even more bullish. ULSD has broken into price territory not seen since early 2016. Trading now around $2.4070, price could reach an objective of $2.50 or even $2.75.
ULSD Continuation Chart As of September 28, 2018 Source: CME
Supply/Demand Balances
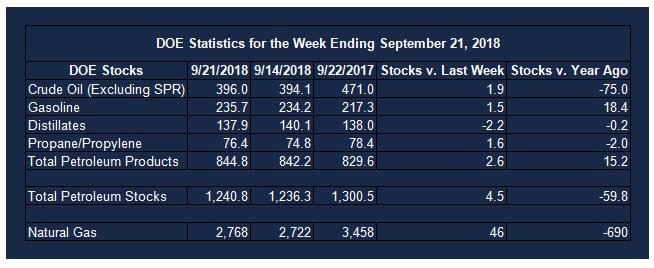
Supply/demand data in the United States for the week ending September 21, 2018 were released by the Energy Information Administration.
Total commercial stocks of petroleum rose 4.5 million barrels during the week ending September 21, 2018.
There were builds in stocks of gasoline, K-jet fuel, residual fuel, and propane. There were draws in stocks of fuel ethanol, distillate fuel oil, and other oils.
Commercial crude oil supplies in the United States increased to 396.0 million barrels, a build of 1.9 million barrels.
Crude oil supplies increased in four of the five PAD Districts. PAD District 2 (Midwest) stocks rose 0.7 million barrels, PADD 3 (Gulf Coast) stocks were up 0.4 million barrels, PADD 4 (Rockies) stocks increased 0.1 million barrels, and PADD 5 (West Coast) stocks gained 0.6 million barrels. PADD 1 (East Coast) stock were unchanged from the previous report week.
Cushing, Oklahoma inventories increased 0.5 million barrels from the previous report week to 22.8 million barrels.
Domestic crude oil production increased 100,000 barrels daily from the previous report week to 11.1 million barrels per day.
Crude oil imports averaged 7.802 million barrels per day, a daily decrease of 222,000 barrels per day. Exports increased 273,000 barrels daily to 2.640 million barrels per day.
Refineries used 90.4 per cent of capacity, a decrease of 5.0 percentage points from the previous report week.
Crude oil inputs to refineries decreased 901,000 barrels daily; there were 16.514 million barrels per day of crude oil run to facilities. Gross inputs, which include blending stocks, declined 932,000 barrels daily to 16.816 million barrels daily.
Total petroleum product inventories saw an increase of 2.6 million barrels from the previous report week.
Gasoline stocks increased 1.5 million barrels from the previous report week; total stocks are 235.7 million barrels.
Demand for gasoline decreased 547,000 barrels per day to 8.987 million barrels per day.
Total product demand decreased 1.135 million barrels daily to 19.999 million barrels per day.
Distillate fuel oil stocks decreased 2.2 million barrels from the previous report week; distillate stocks are 137.9 million barrels. National distillate demand was reported at 4.291 million barrels per day during the report week. This was a weekly increase of 139,000 barrels daily.
Propane stocks rose 1.6 million barrels from the previous report week; propane stock are 76.4 million barrels. Current demand is estimated at 0.867 million barrels per day, a decrease of 313,000 barrels daily from the previous report week.
Natural Gas
According to the Energy Information Administration:
Net injection levels of natural gas are lower than the five-year average. Net injections into storage totaled 46 Bcf for the week ending September 21, compared with the five-year (2013–17) average net injections of 81 Bcf and last year’s net injections of 64 Bcf during the same week. Working gas stocks totaled 2,768 Bcf, which is 621 Bcf lower than the five-year average and 690 Bcf lower than last year at this time.
Working gas stocks’ deficit to the five-year range increased. The average rate of net injections into storage is 16% lower than the five-year average so far in the 2018 refill season, which covers April through October. If the rate of injections into working gas matched the five-year average of 10.7 Bcf/d for the remainder of the refill season, total inventories would be 3,194 Bcf on October 31, which is 621 Bcf lower than the five-year average of 3,815 Bcf.
The impact of natural gas from renewable sources is being felt in electricity generation. EIA reports since “November 2016, more than 75% of Maine’s electricity generation has come from renewable sources, including hydroelectricity. Natural gas accounted for, on average, 19% of electric generation during the same time period, compared to ten years ago, when natural gas accounted for, on average, almost 50% of Maine’s generation. Between 2007 and 2017, Maine was the only state—of the 11 states that used natural gas as the primary fuel source for power generation—where natural gas no longer had the largest share.
Even though current demand is being met with a combination of renewables, natural gas, and Canadian imports, additional natural gas infrastructure is under consideration to maintain reliability in Maine and New England.”
Futures trading involves significant risk and is not suitable for everyone. Transactions in securities futures, commodity and index futures and options on future markets carry a high degree of risk. The amount of initial margin is small relative to the value of the futures contract, meaning that transactions are heavily “leveraged”. A relatively small market movement will have a proportionately larger impact on the funds you have deposited or will have to deposit: this may work against you as well as for you. You may sustain a total loss of initial margin funds and any additional funds deposited with the clearing firm to maintain your position. If the market moves against your position or margin levels are increased, you may be called upon to pay substantial additional funds on short notice to maintain your position. If you fail to comply with a request for additional funds within the time prescribed, your position may be liquidated at a loss and you will be liable for any resulting deficit. Past performance may not be indicative of future results. This is not an offer to invest in any investment program.
Powerhouse is a registered affiliate of Coquest, Inc.
Was this helpful? We’d like your feedback.
Please respond to [email protected]
Copyright© 2018 Powerhouse, All rights reserved.