Winter Fuels Inventories Remain at Risk
- Inventories reported small weekly growth
- Stocks still near minimum operating levels
- ULSD days supply near low at 33 days
- Natural gas trading in a range

Alan Levine—Chairman, Powerhouse
(202) 333-5380
The Matrix
Stocks of crude oil and petroleum products have been on the decline since mid-July 2020. During that time, there have been very few indications of a recovery in inventories and, along with other statistical measures, low inventories have contributed to a generally bullish outlook for petroleum prices.
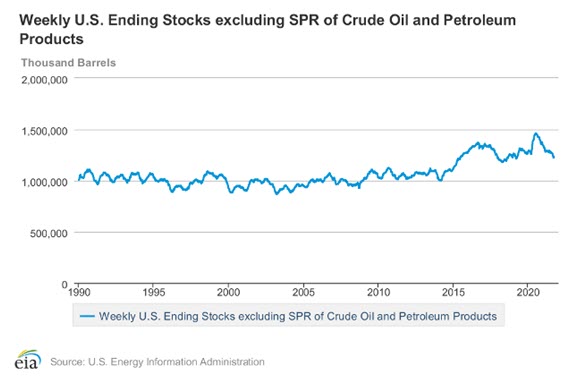
Crude Stocks 1990 – 2021 Source: EIA
EIA’s report of petroleum supply and demand for the week ended Sept. 24, 2021, showed a small build in oil supplies, perhaps signaling a shift in the supply situation. Product demand had a drop of 754,000 barrels daily for the report week, but such a small decline is well within the range of daily demand recently reported.
Gasoline inventories were reported to be 222 million barrels. ULSD availability was 130 million barrels for the week. Both products are nearing the generally recognized minimum operating level.
It may be helpful to evaluate the importance of inventory levels when compared with some measure of use. This helps eliminate the effect of size on the importance of size. (The importance of, say, 500,000 barrels of gasoline is very different than a similar amount of ULSD.) Some analysts rely on barrels of demand to smooth out the difference.
The Department of Energy provides data on the amount of inventory for every barrel of product used. The most recent weekly report showed there were 32.7 days of ULSD supply. This is well below recent averages. A cold winter or an expansion of demand could lead to unusually high ULSD prices this winter.
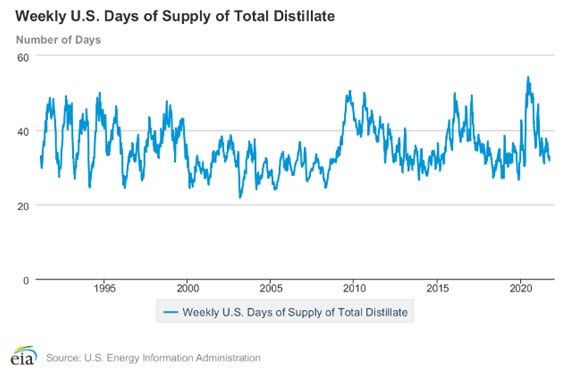
Distillate Days of Supply 1990 – 2021 Source: EIAThe situation for gasoline is similar. There are about 24 days of gasoline in storage. A major difference of course is gasoline now experiences off-season demand which tends to fall. The risk associated with lower supply is much lower now.
ULSD futures have been particularly strong. Last week ended with spot ULSD futures at $2.3827. This was a new high for this commodity which started its most recent run in August 2021 at $1.897, nearly a 50-cent rally. (An even lower bottom was achieved in April 2021 when prices fell to $0.58.) Elliott Wave analysis suggests that ULSD could continue its rally. A nearby objective of $2.70 is possible, perhaps even a shot at $3.
Supply/Demand Balances
Supply/demand data in the United States for the week ended Sep. 24, 2021, were released by the Energy Information Administration.
Total commercial stocks of petroleum rose 10.9 million barrels during the week ended Sept. 24, 2021.
Commercial crude oil supplies in the United States increased by 4.6 million barrels from the previous report week to 418.5 million barrels.
Crude oil inventory changes by PAD District:
PADD 1: Plus 0.8 million barrels to 8.8 million barrels
PADD 2: UNCH at 111.1 million barrels
PADD 3: Plus 3.9 million barrels to 227.8 million barrels
PADD 4: Plus 0.1 million barrels to 23.5 million barrels
PADD 5: Down 0.2 million barrels to 47.3 million barrels
Cushing, Oklahoma, inventories were up 0.2 million barrels from the previous report week to 34 million barrels.
Domestic crude oil production was up 500,000 barrels per day from the previous report week to 11.1 million barrels daily.
Crude oil imports averaged 6.552 million barrels per day, a daily increase of 87,000 barrels. Exports increased 211,000 barrels daily to 3.02 million barrels per day.
Refineries used 88.1% of capacity; 0.6 percentage point higher from the previous report week.
Crude oil inputs to refineries increased 68,000 barrels daily; there were 15.415 million barrels per day of crude oil run to facilities. Gross inputs, which include blending stocks, rose 114,000 barrels daily to 15.977 million barrels daily.
Total petroleum product inventories rose 6.3 million barrels from the previous report week.
Gasoline stocks increased 0.2 million barrels from the previous report week; total stocks are 221.8 million barrels.
Demand for gasoline rose 502,000 barrels per day to 9.399 million barrels per day.
Total product demand decreased 754,000 barrels daily to 20.391 million barrels per day.
Distillate fuel oil stocks rose 0.4 million barrels from the previous report week; distillate stocks are at 129.7 million barrels. EIA reported national distillate demand at 3.973 million barrels per day during the report week, a decrease of 451,000 barrels daily.
Propane stocks increased 2.6 million barrels from the previous report week; propane stocks are at 72.9 million barrels. The report estimated current demand at 1.102 million barrels per day, a decrease of 191,000 barrels daily from the previous report week.
Natural Gas
Spot natural gas futures had a rally of $2.38 in September, topping at $6.28. Prices have since settled into a range between $5.35 and $6. Natural gas injections into underground storage were modestly higher than expected, but even the modestly improved inventory situation was not enough to start a setback in prices.
The role of overseas markets in U.S. futures pricing continues bullishly. European supplies are reportedly at very low levels. Unexpected calming of winds and failing nuclear plants are being supplanted by natural gas. LNG imports in Asia are being obtained at high prices to achieve green targets.
Resistance remains intact at $6.50, last seen in February 2014. Elliott Wave has the natural gas price target around $12.
According to the EIA:
[Natural gas] net injections into storage totaled 88 Bcf for the week ended September 24, compared with the five-year (2016–2020) average net injections of 72 Bcf and last year’s net injections of 74 Bcf during the same week. Working natural gas stocks totaled 3,170 Bcf, which is 213 Bcf lower than the five-year average and 575 Bcf lower than last year at this time.
The average rate of injections into storage is 12% lower than the five-year average so far in the refill season (April through October). If the rate of injections into storage matched the five-year average of 9.1 Bcf/d for the remainder of the refill season, the total inventory would be 3,506 Bcf on October 31, which is 213 Bcf lower than the five-year average of 3,719 Bcf for that time of year.
Was this helpful? We’d like your feedback.
Please respond to [email protected]
Powerhouse Futures & Trading Disclaimer
Copyright 2021 Powerhouse Brokerage, LLC, All rights reserved