Oil Markets Slow As Election Looms
- Speculation on price trends getting louder
- Election competes with other factors
- OPEC+ revenue needs at odds with demand challenges
- La Nina throws a wrench into demand expectations
- Natural gas facilities hold up well in recent hurricanes

Alan Levine—Chairman, Powerhouse
(202) 333-5380
The Matrix
Petroleum futures markets are grinding to a slow crawl—if not to a halt as the Presidential election of 2020 comes closer. Speculation on the direction of prices becomes louder with bulls and bears offering their idea of a post-election future.
The election outcome, as important as it might be for the future of oil supply, demand and ultimately price, will not be alone in determining oil’s situation. OPEC and now, OPEC+ nations are being squeezed between inflated national budgets and a global market where demand may not cooperate.
Concerns that Covid-19 will hit harder this winter with the impact of mandated shutdowns paints a bearish picture for the market. Weather is the least predictable price determinant. Many experts anticipate another generally mild winter for most of the eastern states with nearly normal snow in New England. This adds to the bearish sentiment.
If the election produces a Democratic presidential victory, markets could react with expectations of a new economic stimulus providing a bullish shove for prices. The situation for oil and natural gas producers could become more demanding as the regulatory scene becomes more fraught. Regulations could include restrictions on methane, limits on federal land drilling and approvals for pipelines.
Renewable energy deployment should speed up. This would require new infrastructure and an associated fiscal stimulus.
A Trump victory would leave current policies supporting oil and gas production in place. But investors are shifting their focus to measures of Environmental, Social and Corporate Governance (ESG) and moving capital spending away from hydrocarbon fuels. Thus, the effect of a Republican win on prices might be small.
Some analysts believe that the outcome of the election will not affect the longer-term outlook at all. This expectation reflects growth in oil demand offsetting new supply from Iran. Higher cost of production will cause falling U.S. oil supply.
Supply/Demand Balances
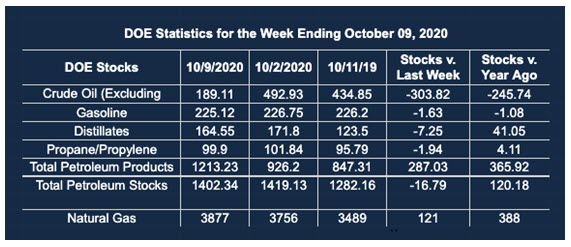
Supply/demand data in the United States for the week ended Oct. 9, 2020, were released by the Energy Information Administration.
Total commercial stocks of petroleum fell by 16.8 million barrels during the week ended Oct. 9, 2020.
Commercial crude oil supplies in the United States decreased by 3.8 million barrels from the previous report week to 489.1 million barrels.
Crude oil inventory changes by PAD District:
PADD 1: Plus 0.5 million barrels to 11.9 million barrels
PADD 2: Plus 2.0 million barrels to 144.7 million barrels
PADD 3: Down 5.2 million barrels to 256.3 million barrels
PADD 4: Plus 0.3 million barrels to 23.7 million barrels
PADD 5: Down 1.6 million barrels to 52.4 million barrels
Cushing, Oklahoma inventories were up 2.9 million barrels from the previous report week to 59.4 million barrels.
Domestic crude oil production fell 500,000 barrels per day to 10.5 million barrels daily.
Crude oil imports averaged 5.286 million barrels per day, a daily decrease of 447,000 barrels. Exports decreased 524,000 barrels daily to 2.135 million barrels per day.
Refineries used 75.1 percent of capacity, down 2.0% from the previous report week.
Crude oil inputs to refineries decreased 276,000 barrels daily; there were 13.577 million barrels per day of crude oil run to facilities. Gross inputs, which include blending stocks, fell 376,000 barrels daily to reach 13.986 million barrels daily.
Total petroleum product inventories fell 13.0 million barrels from the previous report week.
Gasoline stocks decreased 1.6 million barrels daily from the previous report week; total stocks are 225.1 million barrels.
Demand for gasoline fell 320,000 barrels per day to 8.576 million barrels per day.
Total product demand increased 1.130 million barrels daily to 19.475 million barrels per day.
Distillate fuel oil stocks decreased 7.2 million barrels from the previous report week; distillate stocks are at 164.6 million barrels. EIA reported national distillate demand at 4.175 million barrels per day during the report week, an increase of 307,000 barrels daily.
Propane stocks decreased 1.9 million barrels from the previous report week; propane stocks are 99.9 million barrels. The report estimated current demand at 1.138 million barrels per day, a decrease of 61,000 barrels daily from the previous report week.
Natural Gas
This has been among the most extensive hurricane seasons ever recorded along the Gulf Coast. There have been 25 named storms, second most active on record. Hurricane Laura was the first Category 4 landfall ever recorded in southwestern Louisiana. Six weeks later, Hurricane Delta made landfall as a Category 2 storm. Both landed in the area where nearly 90 percent of U.S. LNG export capability is located.
The intensity of these storms would probably have idled operational facility capacity for extended periods in previous years. This year, however, activity recovered rapidly. Notably, Sabine Pass LNG terminal operated during H. Delta. The ability to operate even during times of stress supports U.S. natural gas exports. It’s ultimately bullish for both natural gas and propane.
According to the EIA:
The net injections [of natural gas] into storage totaled 46 Bcf for the week ending October 9, compared with the five-year (2015–19) average net injections of 87 Bcf and last year’s net injections of 102 Bcf during the same week. Working natural gas stocks totaled 3,877 Bcf, which is 353 Bcf more than the five-year average and 388 Bcf more than last year at this time.
The average rate of injections into storage is 2% higher than the five-year average so far in the refill season (April through October). If the rate of injections into storage matched the five-year average of 9. Bcf/d for the remainder of the refill season, the total inventory would be 4,076 Bcf on October 31, which is 353 Bcf higher than the five-year average of 3,723 Bcf for that time of year.
Was this helpful? We’d like your feedback.
Please respond to [email protected]
Powerhouse Futures & Trading Disclaimer
Copyright 2020 Powerhouse Brokerage, LLC, All rights reserved