Oil Prices Soften
- ULSD spot futures lost more than $1.45 this autumn.
- Year-end state taxes reduce supply.
- Product distribution under threat.
- Current natural gas storage equals its five-year average.
Sincerely,
Alan Levine, Chairman
Powerhouse
(202) 333-5380
The Matrix
Thanksgiving week oil prices ended on a down note. WTI crude oil futures fell $3.80 during the week, settling at $76.28. Commercial crude oil supplies fell to 432 million barrels, a level near the lower end of crude oil availability since 2015.
ULSD prices lost $0.28 cents during the week, settling at $3.24. This was part of a larger drop in diesel fuel prices that began during the week ended October 28. The total decline has been more than $1.45 over this period. If prices of ULSD continue to fall, support can be found at $3.15 and then $2.01.
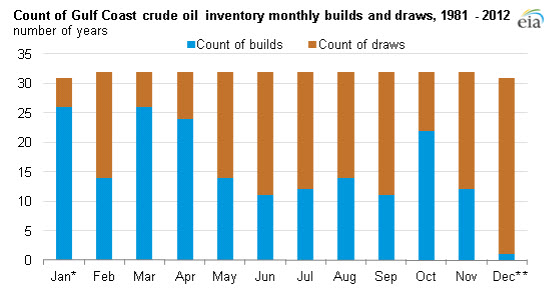
Softer U.S. oil prices are not uncommon late in the year. Impending ad valorum taxes are imposed by Texas and Louisiana (among others) on year-end inventories of petroleum. This results in corporate strategies including transfer and sale of stocks to avoid the tax bite. Lower prices often follow.
An EIA study published in 2013 shows the dramatic decline of Gulf Coast inventories in the month of December. The withdrawals actually begin in November. The taxes have not disappeared. There is no reason to expect that the avoidance strategies of 1981-2012 would have changed. In fact, price and market history since then support this explanation even today.
Weakness carries over into product prices. And in view of the unstable situation facing domestic ULSD supply this winter, soft ULSD prices could rapidly reverse should weather, foreign warfare or geopolitical conflict reach critical mass.

Powerhouse’s continuing commentary on the unstable situation with ULSD days’ supply has reached a new phase. Days’ supply of ULSD has little changed in recent months, but the downward trajectory of historical minimum supply has caught up with the current situation, and supply measured in days’ availability is no worse than the low of the past five years.
If this were all, days’ supply would be merely an interesting statistic. But as documented extensively in recent Weekly Energy Market Situations, the risks of low inventories are compounded by challenges throughout the distribution network. Refining has suffered from reduced investment. Pipeline bottlenecks along the East Coast have become a constant concern. And limits on coastal shipping because of the exclusionary Jones Act could inhibit supply this winter.
Supply/Demand Balances
Supply/demand data in the United States for the week ended November 18, 2022, were released by the Energy Information Administration.
Total commercial stocks of petroleum fell (⬇) 3.3 million barrels to 1.220 billion barrels during the week ended November 18, 2022.
Commercial crude oil supplies in the United States decreased (⬇) by 3.7 million barrels from the previous report week to 431.7 million barrels.
Crude oil inventory changes by PAD District:
PADD 1: Plus (⬆) 0.9 million barrels to 8.6 million barrels
PADD 2: Down (⬇) 0.2 million barrels to 108.5 million barrels
PADD 3: Down (⬇) 3.8 million barrels to 241.2 million barrels
PADD 4: Plus (⬆) 0.4 million barrels to 24.9 million barrels
PADD 5: Down (⬇) 1.0 million barrels to 48.5 million barrels
Cushing, Oklahoma, inventories were down (⬇) 0.9 million barrels from the previous report week to 24.7 million barrels.
Domestic crude oil production was unchanged from the previous report week at 12.1 million barrels daily.
Crude oil imports averaged 7.063 million barrels per day, a daily increase (⬆) of 1,504,000 barrels. Exports increased (⬆) 380,000 barrels daily to 4.242 million barrels per day.
Refineries used 93.9% of capacity; 1.0 percentage points higher (⬆) than the previous report week.
Crude oil inputs to refineries increased (⬆) 258,000 barrels daily; there were 16.410 million barrels per day of crude oil run to facilities. Gross inputs, which include blending stocks, rose (⬆) 175,000 barrels daily to 16.863 million barrels daily.
Total petroleum product inventories rose (⬆) by 7.1 million barrels from the previous report week, rising to 788.4 million barrels.
Total product demand decreased (⬇) 1.210 million barrels daily to 19.878 million barrels per day.
Gasoline stocks increased (⬆) 3.1 million barrels from the previous report week; total stocks are 211.0 million barrels.
Demand for gasoline decreased (⬇) 416,000 barrels per day to 8.327 million barrels per day.
Distillate fuel oil stocks increased (⬆) 1.7 million barrels from the previous report week; distillate stocks are at 109.1 million barrels. EIA reported national distillate demand at 3.846 million barrels per day during the report week, a decrease (⬇) of 18,000 barrels daily.
Propane stocks increased (⬆) by 1.2 million barrels from the previous report week to 89.0 million barrels. The report estimated current demand at 874,000 barrels per day, a decrease (⬇) of 69,000 barrels daily from the previous report week.
Natural Gas
The front-month Henry Hub natural gas futures contract had a strong day last week on Wednesday, November 23. It opened at $6.900 and hit an intra-day high of $7.604. However, on Thursday and Friday, the market failed to hold that gain and settled just above the $7.00 mark. The rally phase that has been in force since late October remains capped until the $7.00 – $7.25 zone can be surpassed on a sustained basis. Nearby support is found in the $5.70 – $6.00 zone.
Domestic underground storage is now the same as the average of the past five years, dampening concerns over supply shortfalls this winter.
Renewed activity at Freeport remains uncertain, but December is apparently the facility’s restart month. Ironically, the European Union, one of Freeport’s principal markets, has improved its storage situation markedly.
European storage is now 90% full. And Russia’s share of regional imports is now reportedly under 10%. The EU may not be out of the woods for winter natural gas supply, but its standing is certainly improved over earlier this year. And a problematical economic outlook could weaken natural gas demand next year.
According to the EIA:
Working gas in storage was 3,564 Bcf as of Friday, November 18, 2022, according to EIA estimates. This represents a net decrease of 80 Bcf from the previous week. Stocks were 62 Bcf less than last year at this time and 39 Bcf below the five-year average of 3,603 Bcf. At 3,564 Bcf, total working gas is within the five-year historical range.

Was this helpful? We’d like your feedback.
Please respond to [email protected]
Powerhouse Futures & Trading Disclaimer
Copyright 2022 Powerhouse Brokerage, LLC, All rights reserved