Checking in on the Fundamentals
- International Energy Agency adapts their outlook
- Crude oil supply glut believed by most to stem from supply rather than demand issues
- Crack spreads drive refiner behavior
- Natural gas supplies robust as first withdrawal looms
Sincerely,
David Thompson, CMT
Executive Vice President
Powerhouse
(202) 333-5380
The Matrix
The impending crude oil supply glut has featured prominently in oil market analyses over the past month. Most recently, the International Energy Agency came out with a projection of more than 4 million barrels per day of oversupply in 2026. A market observer might reasonably ask, if everyone knows the excess supply is on the way, why hasn’t the crude oil futures market shown even greater weakness to date?
It’s important to remember that all these 2026 prognostications are projections of future supply and future demand. Most of the market commentators believe the bulk of oversupply will be the result of more barrels coming to market – as opposed to a shortfall in demand. Demand has been underpinned by profit motive, the most powerful market force. Outside of a few power plants that can run on crude oil, refiners are the sole demanders.
With diesel crack spreads trading at highs not seen since February 2024, refiners are heavily incented to maintain (or increase) refinery throughput – and therefore support crude oil demand.
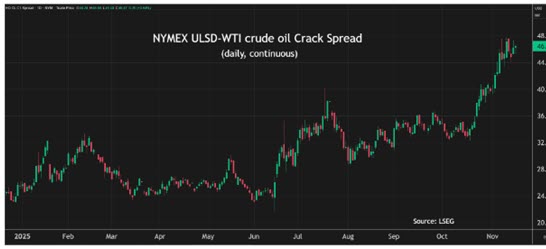
The exceptionally strong diesel crack spreads have had another effect on market fundamentals. Over the course of the last six months, U.S. refiners have been making more diesel than gasoline on a relative basis. This has driven U.S. stocks of gasoline to well below the low of the 5-year range.

The futures market currently prices February diesel cracks at more than twice the value of gasoline crack spreads, suggesting refiners will continue to have an incentive to produce as much diesel as possible. This is a challenge to increasing U.S. gasoline inventories.
POWERHOUSE will be closely monitoring both wholesale gasoline inventories and the refinery yield percentages in the coming weeks for their impact on refined products prices.
Supply/Demand Balances
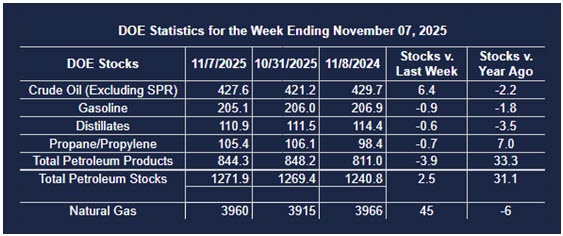
Supply/demand data in the United States for the week ended November 7, 2025, were released by the Energy Information Administration.
Total commercial stocks of petroleum increased (⬆) 2.5 million barrels to 1.2719 billion barrels during the week ended November 7th, 2025.
Commercial crude oil supplies in the United States were higher (⬆) by 6.4 million barrels from the previous report week to 427.6 million barrels.
Crude oil inventory changes by PAD District:
PADD 1: Up (⬆) 0.2 million barrels to 8.3 million barrels
PADD 2: Down (⬇) 0.6 million barrels to 103.9 million barrels
PADD 3: Up (⬆) 5.8 million barrels to 243.3 million barrels
PADD 4: Up (⬆) 0.9 million barrels to 24.5 million barrels
PADD 5: Up (⬆) 0.1 million barrels to 47.5 million barrels
Cushing, Oklahoma, inventories were down (⬇) 0.4 million barrels to 22.5 million barrels.
Domestic crude oil production increased (⬆) 211,000 barrels per day from the previous report to 13.862 million barrels per day.
Crude oil imports averaged 5.222 million barrels per day, a daily decrease (⬇) of 703,000 barrels. Exports decreased (⬇) 1,551,000 barrels daily to 2.816 million barrels per day.
Refineries used 89.4% of capacity; an increase (⬆) of 3.4% from the previous report week.
Crude oil inputs to refineries increased (⬆) 717,000 barrels daily; there were 15.973 million barrels per day of crude oil run to facilities. Gross inputs, which include blending stocks, decreased (⬇) 623,000 barrels daily to 16.238 million barrels daily.
Total petroleum product inventories decreased (⬇) by 3.9 million barrels from the previous report week, down to 844.3 million barrels.
Total product demand increased (⬆) 415,000 barrels daily to 20.770 million barrels per day.
Gasoline stocks decreased (⬇) 0.9 million barrels from the previous report week; total stocks are 205.1 million barrels.
Demand for gasoline increased (⬆) 154,000 barrels per day to 9.028 million barrels per day.
Distillate fuel oil stocks decreased (⬇) 0.6 million barrels from the previous report week; distillate stocks are at 110.9 million barrels. EIA reported national distillate demand at 4.018 million barrels per day during the report week, an increase (⬆) of 308,000 barrels daily.
Propane stocks fell (⬇) 0.7 million barrels from the previous report to 105.4 million barrels. The report estimated current demand at 1,158,000 barrels per day, an increase (⬆) of 214,000 barrels daily from the previous report week.
Natural Gas
This week may see the first inventory draw of the season for the natural gas market. Early estimates look for a decline in storage of between 3 to 17 bcf. Refill season finished very similar to 2024 and at one of the highest levels since 2016.

According to the EIA:
- Net injections into storage totaled 45 Bcf for the week ended November 7, compared with the five-year (2020–24) average net injections of 35 Bcf and last year’s net injections of 45 Bcf during the same week. Working natural gas stocks totaled 3,960 Bcf, which is 172 Bcf (5%) more than the five-year average and 6 Bcf (0%) lower than last year at this time.
Was this helpful? We’d like your feedback.
Please respond to [email protected]
This material has been prepared by a sales or trading employee or agent of Powerhouse Brokers, LLC and is, or is in the nature of, a solicitation. This material is not a research report prepared by Powerhouse Brokers, LLC. By accepting this communication, you agree that you are an experienced user of the futures markets, capable of making independent trading decisions, and agree that you are not, and will not, rely solely on this communication in making trading decisions.
DISTRIBUTION IN SOME JURISDICTIONS MAY BE PROHIBITED OR RESTRICTED BY LAW. PERSONS IN POSSESSION OF THIS COMMUNICATION INDIRECTLY SHOULD INFORM THEMSELVES ABOUT AND OBSERVE ANY SUCH PROHIBITION OR RESTRICTIONS. TO THE EXTENT THAT YOU HAVE RECEIVED THIS COMMUNICATION INDIRECTLY AND SOLICITATIONS ARE PROHIBITED IN YOUR JURISDICTION WITHOUT REGISTRATION, THE MARKET COMMENTARY IN THIS COMMUNICATION SHOULD NOT BE CONSIDERED A SOLICITATION.
The risk of loss in trading futures and/or options is substantial and each investor and/or trader must consider whether this is a suitable investment. Past performance, whether actual or indicated by simulated historical tests of strategies, is not indicative of future results. Trading advice is based on information taken from trades and statistical services and other sources that Powerhouse Brokers, LLC believes are reliable. We do not guarantee that such information is accurate or complete and it should not be relied upon as such. Trading advice reflects our good faith judgment at a specific time and is subject to change without notice. There is no guarantee that the advice we give will result in profitable trades.
Copyright 2025 Powerhouse Brokers, LLC, All rights reserved