Inflation Takes a Hit
- Consumer prices rose by less than expectations
- Energy prices fought the retreat, moving 19.8% for ULSD
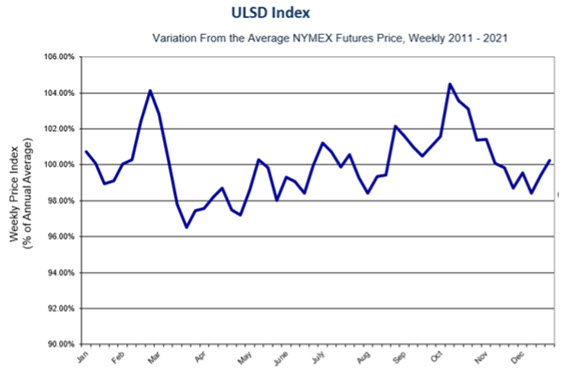
- Pre-winter ULSD prices may be near a seasonal low
- Natural gas withdrawal begins with storage near the 5-year average.
Sincerely,
Alan Levine, Chairman
Powerhouse
(202) 333-5380

The Matrix
Economic news for the United States turned positive last month. Inflation, one of the main concerns of Americans, dropped in October. The data came in below expectations for both “headline,” and “core” inflation.
The Bureau of Labor Statistics reported the Consumer Price Index for All Urban Consumers rose 0.4%. “Core” inflation, prices for all goods except food and energy, rose only 0.3%.
Energy commodity prices were outliers in the CPI report. Fuel oil prices rose 19.8 per cent during the month of October. Gasoline rose 4.0 per cent. But these results were outliers.
Some analysts suggest that these data may represent a peak in the post-pandemic period. Confirmation of slower inflation could translate into Federal Reserve action to slow its pattern of tighter interest rates. The U.S. dollar’s value fell too, opening the prospect of improved terms of trade.
Employment continues apace and even the most pessimistic projections do not suggest unemployment moving much above 5%. This is quite a contrast from the locked-down Covid economy that brought unemployment rates to 15%. On balance, then, very good news for the economy.
Petroleum markets will continue to face their own challenges of insufficient refining capacity, export of distillates in the face of East Coast shortfalls and climate changes.
The ULSD Price Index shown below reminds traders that the pre-winter price low is upon us. If history prevails, markets may anticipate prices bottoming around this time. Distillate shortfalls have been documented here by Powerhouse several times in recent Weekly Energy Market Situation reports. And gasoline, with supplies at a low, will start rebuilding stocks in expectation of the spring and a renewed driving season.
Supply/Demand Balances
Supply/demand data in the United States for the week ended November 4, 2022, were released by the Energy Information Administration.
Total commercial stocks of petroleum fell (⬇) 0.8 million barrels to 1.223 billion barrels during the week ended November 4, 2022.
Commercial crude oil supplies in the United States increased (⬆) by 3.9 million barrels from the previous report week to 440.8 million barrels.
Crude oil inventory changes by PAD District:
PADD 1: Plus (⬆) 0.8 million barrels to 8.4 million barrels
PADD 2: Down (⬇) 0.9 million barrels to 111.5 million barrels
PADD 3: Plus (⬆) 1.4 million barrels to 247.4 million barrels
PADD 4: Plus (⬆) 0.7 million barrels to 23.9 million barrels
PADD 5: Plus (⬆) 2.0 million barrels to 49.5 million barrels
Cushing, Oklahoma, inventories were down (⬇) 1 million barrels from the previous report week to 27.2 million barrels.
Domestic crude oil production was up (⬆) from the previous report week at 12.1 million barrels daily.
Crude oil imports averaged 6.454 million barrels per day, a daily increase (⬆) of 249,000 barrels. Exports decreased (⬇) 404,000 barrels daily to 3.521 million barrels per day.
Refineries used 92.1% of capacity; 1.5 percentage points higher (⬆) than the previous report week.
Crude oil inputs to refineries increased (⬆) 247,000 barrels daily; there were 16.089 million barrels per day of crude oil run to facilities. Gross inputs, which include blending stocks, rose (⬆) 285,000 barrels daily to 16.551 million barrels daily.
Total petroleum product inventories fell (⬇) by 4.8 million barrels from the previous report week, falling to 782.5 million barrels.
Total product demand increased (⬆) 785,000 barrels daily to 21.267 million barrels per day.
Gasoline stocks decreased (⬇) 0.9 million barrels from the previous report week; total stocks are 205.7 million barrels.
Demand for gasoline increased (⬆) 352,000 barrels per day to 9.011 million barrels per day.
Distillate fuel oil stocks decreased (⬇) 0.5 million barrels from the previous report week; distillate stocks are at 106.3 million barrels. EIA reported national distillate demand at 4.161 million barrels per day during the report week, a decrease (⬇) of 96,000 barrels daily.
Propane stocks decreased (⬇) by 0.3 million barrels from the previous report week to 87.7 million barrels. The report estimated current demand at 1.205 million barrels per day, an increase (⬆) of 171,000 barrels daily from the previous report week.
Natural Gas
Natural gas in storage in the United States is rapidly approaching its five-year average level. LNG exports from Freeport, LA are still under review, demand-killing weather like H. Nicole and the EU’s storage north of 90% have contributed to this phenomenon.
Last week’s EIA Natural Gas Weekly Update reported the completion of 2022’s injection season. The United States begins the withdrawal phase for the winter with about 3.5 Tcf in underground storage. EIA says, “This is the second lowest second-lowest end-of-refill-season inventory level since 2008.” This could support prices in November, when HDDs are expected to be “near of below average across much of the U.S east of the Rockies …”
Moreover, The Old Farmer’s Almanac forecasts “Winter will be colder than normal, on average, with the coldest periods in late November, early December, early to mid-January, and mid- to late February. Precipitation and snowfall will be above average in the east.”
Natural gas prices advanced from $4.75 on October 24. Last Monday, they reached $6.94. The price candlestick for that day was a “doji,” A chart pattern in which the daily opening a closing prices are the same.
The doji is not a reversal indicator. It shows indecision. And, during last week’s action, prices did fall, though not significantly. The final days of the week traded essentially flat. Powerhouse believes the rally is intact and could recover its upward track.
According to the EIA:
Working gas in storage was 3,580 Bcf as of Friday, November 4, 2022, according to EIA estimates. This represents a net increase of 79 Bcf from the previous week. Stocks were 37 Bcf less than last year at this time and 76 Bcf below the five-year average of 3,656 Bcf. At 3,580 Bcf, total working gas is within the five-year historical range.
Was this helpful? We’d like your feedback.
Please respond to [email protected]
Powerhouse Futures & Trading Disclaimer
Copyright 2022 Powerhouse Brokerage, LLC, All rights reserved