The New Horizon in Oil Production
- Other S. American nations join Brazil in ramping oil production
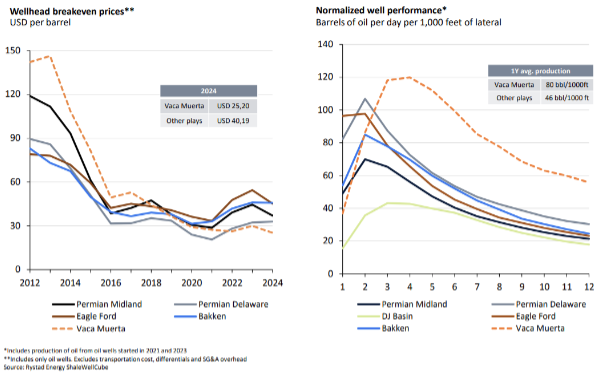
- Argentina’s Vaca Muerta field could rival the Permian
- 2025 marks an inflection point in non-OPEC+ supply growth
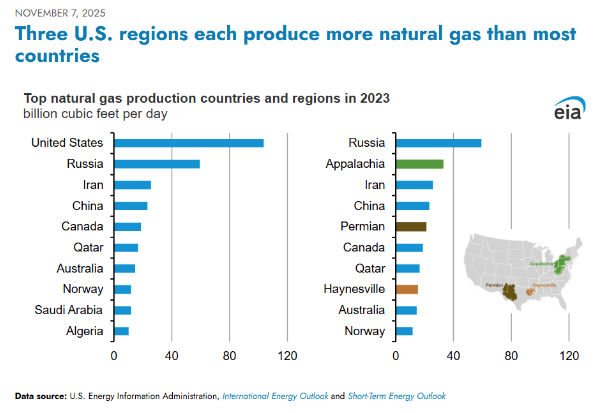
- Three regions drive U.S. dominance in natural gas output
Sincerely,
David Thompson, CMT
Executive Vice President
Powerhouse
(202) 333-5380

The Matrix
Brazil is well known as the crude oil powerhouse of South America. The EIA ranks it as the 6th largest oil-producing nation, pumping nearly 4.9 million barrels per day (bpd). What may not be as well-known is the fact that several of Brazil’s fellow South American nations are poised to significantly increase their crude oil output and, with Brazil, are likely to be the prime drivers in non-OPEC+ supply growth through 2030.
The colossal Stabroek block off the coast of Guyana is estimated to contain over 11 billion barrels of oil and contributes to the country’s roughly 740,000 bpd of production. Next-door neighbor Suriname currently produces a minimal amount of crude, but that is set to jump to over 200,000 bpd by 2028 as their GranMorgu project comes into service.
Argentina’s promise of becoming a hydrocarbon producing giant is now arriving. The Vaca Muerta field is believed to hold the world’s fourth largest shale oil deposit and mid-year output was near 800,000 bpd – more than 16% higher, year-over-year.
Not only prolific, the Vaca Muerta boasts cost metrics superior even to those of the world-class U.S. shale fields.
In 2025, South America will add 560,000 bpd of crude and condensate production whereas North America will add 480,000 bpd. By 2026, one consulting firm estimates that South America will be adding 750,000 bpd and will be the largest driver of non-OPEC+ production growth. As North American shale plays plateau, the market’s attention will shift to the south.
Supply/Demand Balances
Supply/demand data in the United States for the week ended October 31, 2025, were released by the Energy Information Administration.
Total commercial stocks of petroleum increased (⬆) 0.6 million barrels to 1.2694 billion barrels during the week ended October 31st, 2025.
Commercial crude oil supplies in the United States were higher (⬆) by 5.2 million barrels from the previous report week to 421.2 million barrels.
Crude oil inventory changes by PAD District:
PADD 1: Unchanged (=) at 8.1 million barrels
PADD 2: Up (⬆) 0.8 million barrels to 104.5 million barrels
PADD 3: Up (⬆) 3.2 million barrels to 237.5 million barrels
PADD 4: Up (⬆) 0.2 million barrels to 23.6 million barrels
PADD 5: Up (⬆) 0.9 million barrels to 47.4 million barrels
Cushing, Oklahoma, inventories were up (⬆) 0.3 million barrels to 22.9 million barrels.
Domestic crude oil production increased (⬆) 7,000 barrels per day from the previous report to 13.651 million barrels per day.
Crude oil imports averaged 5.924 million barrels per day, a daily increase (⬆) of 873,000 barrels. Exports increased (⬆) 6,000 barrels daily to 4.367 million barrels per day.
Refineries used 86.0% of capacity; a decrease (⬇) of 0.6% from the previous report week.
Crude oil inputs to refineries increased (⬆) 37,000 barrels daily; there were 15.256 million barrels per day of crude oil run to facilities. Gross inputs, which include blending stocks, decreased (⬇) 102,000 barrels daily to 15.615 million barrels daily.
Total petroleum product inventories decreased (⬇) by 4.5 million barrels from the previous report week, down to 848.2 million barrels.
Total product demand decreased (⬇) 926,000 barrels daily to 20.356 million barrels per day.
Gasoline stocks decreased (⬇) 4.7 million barrels from the previous report week; total stocks are 206.0 million barrels.
Demand for gasoline decreased (⬇) 49,000 barrels per day to 8.874 million barrels per day.
Distillate fuel oil stocks decreased (⬇) 0.6 million barrels from the previous report week; distillate stocks are at 111.5 million barrels. EIA reported national distillate demand at 3.710 million barrels per day during the report week, an increase (⬆) of 130,000 barrels daily.
Propane stocks rose (⬆) 0.4 million barrels from the previous report to 106.1 million barrels. The report estimated current demand at 944,000 barrels per day, a decrease (⬇) of 21,000 barrels daily from the previous report week.
Natural Gas
As impressive as South America’s crude oil production narrative is, the United States continues to reign supreme in natural gas production. Last week, EIA released a snapshot of 2023, the most recent year for comprehensive worldwide data. The U.S. produces 75% more than second-place Russia. What is truly amazing is that three regions in the U.S. produce more natural gas than most other countries on Earth.
According to the EIA:
- Net injections into storage totaled 33 Bcf for the week ended October 31, compared with the five-year (2020–24) average net injections of 42 Bcf and last year’s net injections of 68 Bcf during the same week. Working natural gas stocks totaled 3,915 Bcf, which is 162 Bcf (4%) more than the five-year average and 6 Bcf (less than 1%) lower than last year at this time. Working gas natural gas stocks exceed the five-year average in all regions except the East.
Was this helpful? We’d like your feedback.
Please respond to [email protected]
This material has been prepared by a sales or trading employee or agent of Powerhouse Brokers, LLC and is, or is in the nature of, a solicitation. This material is not a research report prepared by Powerhouse Brokers, LLC. By accepting this communication, you agree that you are an experienced user of the futures markets, capable of making independent trading decisions, and agree that you are not, and will not, rely solely on this communication in making trading decisions.
DISTRIBUTION IN SOME JURISDICTIONS MAY BE PROHIBITED OR RESTRICTED BY LAW. PERSONS IN POSSESSION OF THIS COMMUNICATION INDIRECTLY SHOULD INFORM THEMSELVES ABOUT AND OBSERVE ANY SUCH PROHIBITION OR RESTRICTIONS. TO THE EXTENT THAT YOU HAVE RECEIVED THIS COMMUNICATION INDIRECTLY AND SOLICITATIONS ARE PROHIBITED IN YOUR JURISDICTION WITHOUT REGISTRATION, THE MARKET COMMENTARY IN THIS COMMUNICATION SHOULD NOT BE CONSIDERED A SOLICITATION.
The risk of loss in trading futures and/or options is substantial and each investor and/or trader must consider whether this is a suitable investment. Past performance, whether actual or indicated by simulated historical tests of strategies, is not indicative of future results. Trading advice is based on information taken from trades and statistical services and other sources that Powerhouse Brokers, LLC believes are reliable. We do not guarantee that such information is accurate or complete and it should not be relied upon as such. Trading advice reflects our good faith judgment at a specific time and is subject to change without notice. There is no guarantee that the advice we give will result in profitable trades.
Copyright 2025 Powerhouse Brokers, LLC, All rights reserved