

A Bearish Price Case is Building
- Petroleum demand is under pressure
- Thanksgiving air traffic sinks K-Jet demand below one million barrels daily
- Cushing inventories over 80% of capacity
- Natural gas injection season fails four Tcf.

Alan Levine—Chairman, Powerhouse
(202) 333-5380
The Matrix
The United States is entering its third major encounter with COVID-19. The implications of renewed attacks on our economy are by now well-known.
Demand has been decimated in the aviation sector. Data for the week ended Nov. 13, 2020, show demand for K-jet sinking below one million barrels daily – ironic in this pre-Thanksgiving time when air travel tends to peak. Demand for jet for the year to November 13 clocked in at 1.057 million barrels per day, down from the same period in 2019 by more than 40%.
The Transportation Security Administration reported more than one million travelers using U.S. domestic airfields on Friday. This was substantial, but lagged 2019 on the same day. Traffic was 40% of last year’s total. It reflected a deceleration of bookings by carriers and higher cancellations than previously.
More evidence that state and local officials were taking the pandemic more seriously could be seen in newly issued statements if not formal guidance. A joint statement from several Midwestern governors—both Democratic and Republican—urged people to remain at home for the holiday.
Gasoline demand, lighter in winter anyway, should also get less benefit from holiday travel as epidemiologists urge social distancing and reduced family get-togethers.
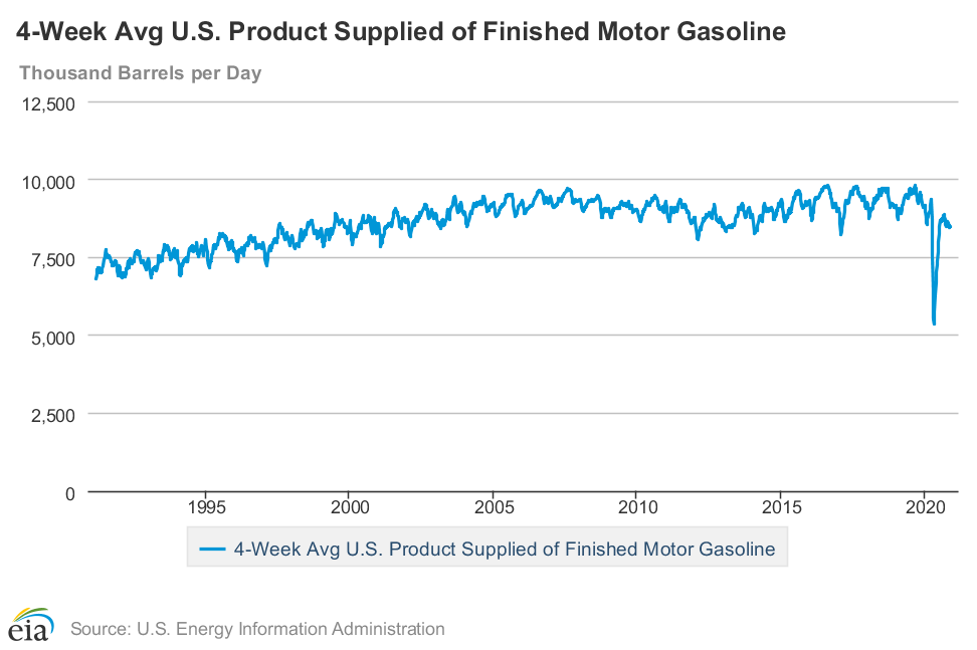
Gasoline Supplied 1990 – 2020 Source: EIA
Gasoline has fought its way back from the 5.3 million barrels daily low seen late in April. Most recently, EIA put demand at 8.3 million barrels per day, but even this was 500,000 barrels daily below the previous week. Year to date, demand has run 8.2 million barrels per day, lagging last year by nearly 13%.
Some support for prices may come from upstream activities. Domestic crude oil production has recovered from earlier lows, reaching 10.9 million daily barrels during the week ended November 13, but well below the 13.1 million barrels per day reached in February.
Refineries have also been operating well below capacity. During the report week, facilities ran at 77.4% of capacity. Fall turnaround has contributed to the slowing of product production.
And behind the weakness in demand and the slowing of refinery operations, crude oil inventories at Cushing OK are building steadily. National stocks, now at 489.5 million barrels, are 39.1 million barrels higher than last year at this time, but generally trending lower.
At Cushing, the pricing point for WTI futures and therefore the United States, inventories are 61.6 million barrels, 17.4 million barrels higher than last year and 26.3 million barrels more than in 2018. They are generally trending higher. The possibility of a basis expansion cannot be ignored as crude oil prices react to the difference between Cushing and national storage levels this winter.
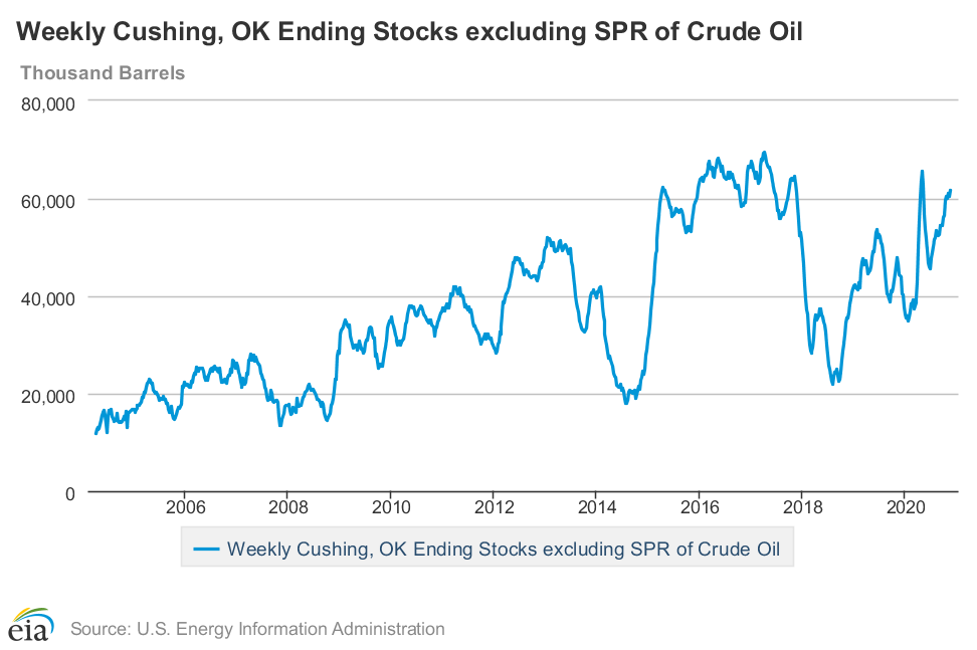
Cushing Crude Stocks 1990 – 2020 Source: EIA
Supply/Demand Balances
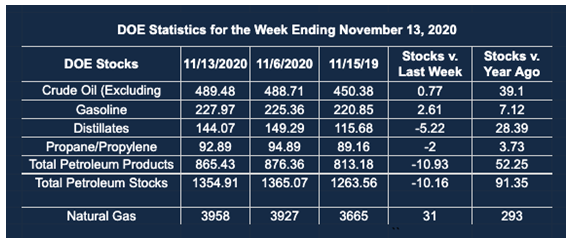
Supply/demand data in the United States for the week ended November 13, 2020, were released by the Energy Information Administration.
Total commercial stocks of petroleum fell by 10.2 million barrels during the week ended November 13, 2020.
Commercial crude oil supplies in the United States increased by 0.8 million barrels from the previous report week to 489.5 million barrels.
Crude oil inventory changes by PAD District:
PADD 1: Plus 0.3 million barrels to 10.3 million barrels
PADD 2: Plus 2.2 million barrels to 148.2 million barrels
PADD 3: Plus 2.3 million barrels to 260.8 million barrels
PADD 4: Down 0.1 million barrels to 24.5 million barrels
PADD 5: Down 1.8 million barrels to 45.7 million barrels
Cushing, Oklahoma inventories were up 1.2 million barrels from the previous report week to 61.6 million barrels.
Domestic crude oil production was up 400,000 barrels per day to 10.9 million barrels daily.
Crude oil imports averaged 5.254 million barrels per day, a daily decrease of 245,000 barrels. Exports decreased 17,000 barrels daily to 2.748 million barrels per day.
Refineries used 77.4% of capacity, up 2.9% from the previous report week.
Crude oil inputs to refineries increased 394,000 barrels daily; there were 13.841 million barrels per day of crude oil run to facilities. Gross inputs, which include blending stocks, rose 541,000 barrels daily to reach 14.414 million barrels daily.
Total petroleum product inventories fell 11.0 million barrels from the previous report week.
Gasoline stocks increased 2.6 million barrels daily from the previous report week; total stocks are 228.0 million barrels.
Demand for gasoline fell 504,000 barrels per day to 8.258 million barrels per day.
Total product demand decreased 616,000 barrels daily to 19.564 million barrels per day.
Distillate fuel oil stocks decreased 5.2 million barrels from the previous report week; distillate stocks are at 144.2 million barrels. EIA reported national distillate demand at 4.225 million barrels per day during the report week, an increase of 170,000 barrels daily.
Propane stocks decreased 2.0 million barrels from the previous report week; propane stocks are 92.9 million barrels. The report estimated current demand at 1.470 million barrels per day, an increase of 173,000 barrels daily from the previous report week.
Natural Gas
The natural gas injection season ended on October 31. Many natural gas observers anticipated a storage level over four Tcf to start this year’s withdrawal season. In fact, the total was 3.920 Tcf.
The total was, nonetheless, the third-highest end-of-injection season ever recorded—And the highest since 2016. Further context is that total stocks as of October 31 were 201 Bcf higher than the five-year average and 194 Bcf higher than last year.
The failure of storage to top four Tcf can be explained in part by unexpected losses in production in 2020. Consumption on the other hand roughly equaled 2019. Increases were seen in the residential and commercial sectors—suggesting that working from home has become a growing sector for natural gas demand.
According to the EIA:
The net injections into storage totaled 31 Bcf for the week ending November 13, compared with the five-year (2015–19) average net withdrawals of 24 Bcf and last year’s net withdrawals of 66 Bcf during the same week. Working natural gas stocks totaled 3,958 Bcf, which is 231 Bcf more than the five-year average and 293 Bcf more than last year at this time.
Was this helpful? We’d like your feedback.
Please respond to [email protected]
Powerhouse Futures & Trading Disclaimer
Copyright 2020 Powerhouse Brokerage, LLC, All rights reserved


