Oil Prices Soften Further
- Inventory increases push prices lower
- The services index moves into an economic contraction zone
- Possible Middle East conciliation hamstrung by actions on the ground
- Record summer heat supports natural gas price
Sincerely
Alan Levine, Chair
Powerhouse
(202) 333-5380
The Matrix
Spot futures prices for crude oil and principal petroleum products accelerated along the downward path established in April. The WTI futures price has lost $8.69 since the first week in April, settling last week at $78.11.
Similar losses were seen in product futures. Gasoline settled the week ended May 3 at $2.5481. This was a weekly loss of nearly nineteen cents. The recent top, basis nearby continuation, was $2.8172. The selloff, thus far, has traveled $0.2621 per gallon.
Distillate fuel oil prices tell much the same story. Spot ULSD futures ended the week at $2.4434. Over April, more than 35 cents have been lost.
Softer prices have developed in recent days. This reflects a dramatic easing of crude oil supply and no serious erosion of product inventories.
The “ISM Services PMI” fell below 50 points. The PMI index is reported as a number—above 50 represents growth or expansion while below 50 represents a contraction.
The ISM Services PMI in the US dropped sharply to 49.4 in April of 2024 from 51.4 in the earlier month, reflecting the first contraction in services sector activity since December of 2022, and surprising market expectations of 52. It was only the second decline in activity since the pandemic-driven crash in the second quarter of 2020…
A reading below 50 in the Services sector indicates economic contraction and possible Federal Reserve action to lower rates and costs of money to businesses. This is bearish for price.
A move towards conciliation has been taking shape in the Middle East. An arrangement among the United States, Saudi Arabia, and Israel could reshape the geopolitics of the Middle East. The deal would strengthen regional defense security and strengthen the position of the United States to the detriment of Iran and perhaps China as well.
Such an agreement could ease tensions in the region, ultimately bearish for price.
Supply/Demand Balances
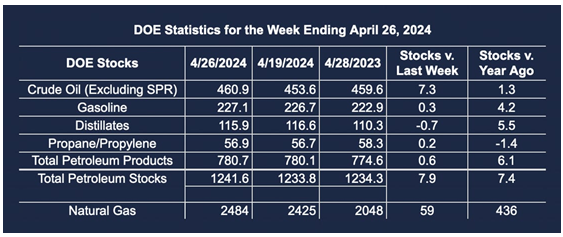
Supply/demand data in the United States for the week ended April 26, 2024, were released by the Energy Information Administration.
Total commercial stocks of petroleum increased (⬆) 7.9 million barrels to 1,241.6 billion barrels during the week ended April 26, 2024.
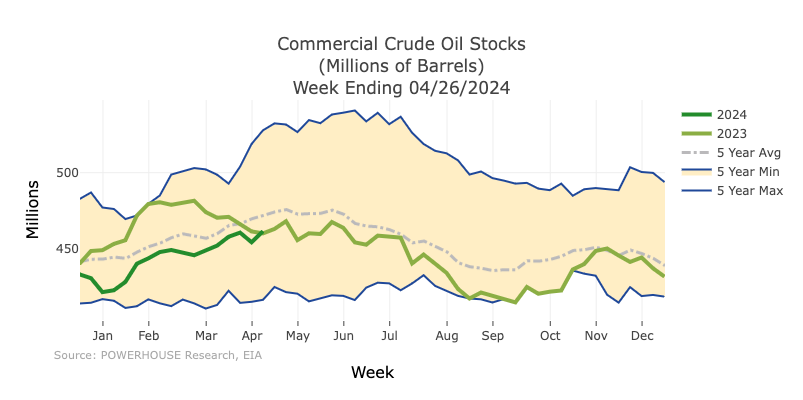
Commercial crude oil supplies in the United States were higher (⬆) by 7.3 million barrels from the previous report week to 460.9 million barrels.
Crude oil inventory changes by PAD District:
PADD 1: Unchanged (=) at 8.3 million barrels
PADD 2: Up (⬆) 0.8 million barrels to 120.7 million barrels
PADD 3: Up (⬆) 6.8 million barrels to 261.6 million barrels
PADD 4: Down (⬇) 0.3 million barrels at 24.8 million barrels
PADD 5: Unchanged (=) at 45.5 million barrels
Cushing, Oklahoma, inventories were higher (⬆) at 33.5 million barrels.
Domestic crude oil production was unchanged (=) at 13.1 million barrels daily.
Crude oil imports averaged 6.772 million barrels per day, a daily increase (⬆) of 275,000 barrels. Exports decreased (⬇) 1,261,000 barrels daily to 3.918 million barrels per day.
Refineries used 87.5% of capacity; 1 percentage point lower (⬇) than the previous report week.
Crude oil inputs to refineries decreased (⬇) 42,000 barrels daily; there were 15.641 million barrels per day of crude oil run to facilities. Gross inputs, which include blending stocks, decreased (⬇) 183,000 barrels daily to 16.117 million barrels daily.
Total petroleum product inventories increased (⬆) by 0.5 million barrels from the previous report week, up to 780.7 million barrels.
Total product demand increased (⬆) 882,000 barrels daily to 20.417 million barrels per day.
Gasoline stocks increased (⬆) 0.3 million barrels from the previous report week; total stocks are 227.1 million barrels.
Demand for gasoline increased (⬆) 195,000 barrels per day to 8.618 million barrels per day.
Distillate fuel oil stocks decreased (⬇) 0.7 million barrels from the previous report week; distillate stocks are at 115.9 million barrels. EIA reported national distillate demand at 3.678 million barrels per day during the report week, an increased (⬆) of 125,000 barrels daily.
Propane stocks rose (⬆) 0.2 million barrels from the previous report to 56.9 million barrels. The report estimated current demand at 1,155,000 barrels per day, an increase (⬆) of 716,000 barrels daily from the previous report week.
Natural Gas
Natural gas futures ended the week of May 3 eking out a new high after spending several weeks in a narrow range between $1.907 and $2.140. Spot futures settled at $2.142. The new high may have been marginal, but it came on high volume and open interest.
It would not be unusual to see buyers use the opportunity of a bullish inventory report in May after weeks of bottoming to get long for summer cooling demand. And the trend toward warmer weather has been confirmed by the National Weather Service. Its forecast calls for record-challenging high temperatures nationally. We may experience the hottest summer ever observed.
Next price resistance will be found at $2.410, basis the spot natural gas continuation chart. Further resistance can be found at $2.884.
Prices advanced because several factors impacted the market. Natural gas flows to Freeport’s LNG export plant touched 2-months highs. In addition, the weekly report on injections to underground storage was short of similar data for last year and the average of the past five years at this time. The weekly Baker-Hughes count of active U.S. natural gas wells drilling fell to a 2 ½ year low. This could translate into lower domestic production, ultimately bullish for price.
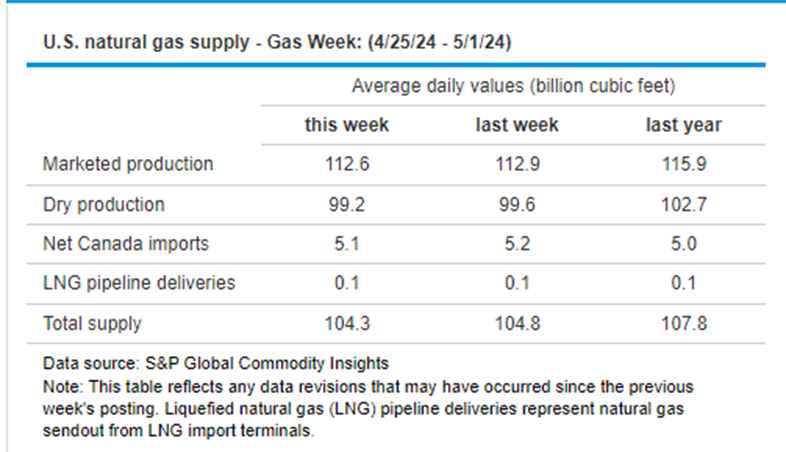
Lower production was a feature of the latest EIA report on the U.S. natural gas supply for the gas week ended May 1. Marketed production of gas was 112.6 Bcf, 3.3 Bcf lower than a year ago. This brought the total supply to 104.3 Bcf for the week, showing a drop similar to dry and marketed production.
The facility at Freeport, Texas said that prolonged outages should not be expected at its LNG plant this summer, leading to expectations of higher exports. Domestic natural gas supply should be reduced, constricting domestic markets.
According to the EIA:
- Net injections into storage totaled 59 Bcf for the week ended April 26, compared with the five-year (2019–2023) average net injections of 72 Bcf and last year’s net injections of 62 Bcf during the same week. Working natural gas stocks totaled 2,484 Bcf, which is 642 Bcf (35%) more than the five-year average and 436 Bcf (21%) more than last year at this time—
- According to The Desk survey of natural gas analysts, estimates of the weekly net change to working natural gas stocks ranged from net injections of 43 Bcf to 74 Bcf, with a median estimate of 57 Bcf.
Was this memo helpful? We’d like your feedback.
Please respond to [email protected]
This material has been prepared by a sales or trading employee or agent of Powerhouse Brokers, LLC and is, or is in the nature of, a solicitation. This material is not a research report prepared by Powerhouse Brokers, LLC. By accepting this communication, you agree that you are an experienced user of the futures markets, capable of making independent trading decisions, and agree that you are not, and will not, rely solely on this communication in making trading decisions.
DISTRIBUTION IN SOME JURISDICTIONS MAY BE PROHIBITED OR RESTRICTED BY LAW. PERSONS IN POSSESSION OF THIS COMMUNICATION INDIRECTLY SHOULD INFORM THEMSELVES ABOUT AND OBSERVE ANY SUCH PROHIBITION OR RESTRICTIONS. TO THE EXTENT THAT YOU HAVE RECEIVED THIS COMMUNICATION INDIRECTLY AND SOLICITATIONS ARE PROHIBITED IN YOUR JURISDICTION WITHOUT REGISTRATION, THE MARKET COMMENTARY IN THIS COMMUNICATION SHOULD NOT BE CONSIDERED A SOLICITATION.
The risk of loss in trading futures and/or options is substantial and each investor and/or trader must consider whether this is a suitable investment. Past performance, whether actual or indicated by simulated historical tests of strategies, is not indicative of future results. Trading advice is based on information taken from trades and statistical services and other sources that Powerhouse Brokers, LLC believes are reliable. We do not guarantee that such information is accurate or complete and it should not be relied upon as such. Trading advice reflects our good faith judgment at a specific time and is subject to change without notice. There is no guarantee that the advice we give will result in profitable trades.
Copyright 2024 Powerhouse Brokers, LLC, All rights reserved