Oil Prices Continue Rally; Bearish News Appears
- Low US inventories meet high US employment
- EU agrees to ban most Russian oil
- OPEC+ agrees to boost oil supply
- Natural gas demand reached 119.2 Bcf/d last winter
Sincerely,
Alan Levine, Chairman
Powerhouse
(202) 333-5380
The Matrix
Product futures continued trading the bullish pattern now seemingly cemented in place since mid-May. The week of June 3 ended with new highs for the July futures contracts in place for both RBOB and ULSD at $4.3096 and $3.792 respectively. WTI crude oil futures also reached a new high of $120.46.
Low petroleum inventories are meeting nearly full employment and record retail gasoline pump prices; all are bullish. The chart below shows total petroleum stocks skidding along a bottom, well under the minimum supply level of the past five years.

Crude and Products Stocks – 5-year Trend 2017-2022, Source: EIA, Powerhouse
There are other bullish data too. The EU has agreed to ban most Russian oil by year-end. Pipeline shipments are excluded. Marine insurance has become more difficult to acquire, further interfering with maritime oil shipments.
China has lifted Covid restrictions, opening the way to normal economic activity. Higher demand can be expected to support prices.
In the United States, the Federal government showed actual job growth faster than expected in May and people returning to the labor force.
American crude oil inventories fell 5.1 million barrels during the week ended May 27. Domestic refining is running at an unsustainable 92.6% of capacity (East Coast facilities are at 98.2% of their capabilities.
Other fundamentals, however, are shifting towards the bearish. Full employment carries the prospect of higher inflation and therefore less spending. These portend a weaker economy and lower fuel demand.
OPEC+ has agreed to provide an added 632,000 barrels per day this summer. This will unwind its earlier cuts earlier than expected. Some producers simply cannot meet higher output quotas. The early increase may become symbolic unless Saudi Arabia fills the gap. This becomes a broader question of US/Saudi relations in view of American policy opposing several Saudi human rights actions.
Another bearish factor here in the United States is a report of some American companies initiating slower hiring and even freezes on employment. A study of hiring plans at small firms shows less appetite for new employees.
Generally, economic news has been unremittingly bullish. But economic activity tends to revert to the mean. In that light, a reversal of the market’s fortunes cannot be written off.
Contrarian thinking sees these conflicting data creating a growing expectation of an at-least-near-term price top. This observation is not supported by technical chart data. There are yet no signs of technical divergence: topping signs or of topping patterns like heads and shoulders or even candlestick forms. The appearance of such indicators should be closely watched and reported.
Supply/Demand Balances
Supply/demand data in the United States for the week ended May 27, 2022, were released by the Energy Information Administration.
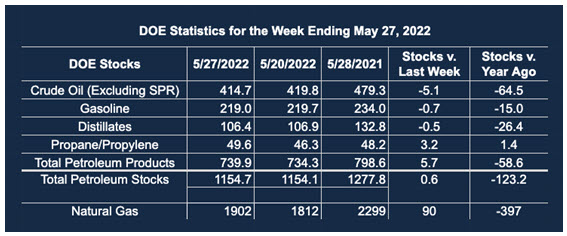
Total commercial stocks of petroleum fell 0.6 million barrels during the week ended May 27, 2022.
Commercial crude oil supplies in the United States decreased by 5.1 million barrels from the previous report week to 414.7 million barrels.
Crude oil inventory changes by PAD District:
PADD 1: Plus 1 million barrels to 9.3 million barrels
PADD 2: Plus 0.3 million barrels to 105 million barrels
PADD 3: Minus 6.8 million barrels to 227.4 million barrels
PADD 4: Plus 0.4 million barrels 24.8 million barrels
PADD 5: Down 0.1 million barrels to 48.1 million barrels
Cushing, Oklahoma, inventories were up 0.2 million barrels from the previous report week to 25 million barrels.
Domestic crude oil production was UNCH from the previous report week at 11.9 million barrels daily.
Crude oil imports averaged 6.218 million barrels per day, a daily decrease of 268,000 barrels. Exports decreased 351,000 barrels daily to 3.99 million barrels per day
Refineries used 92.6% of capacity; 0.6 percentage points lower than the previous report week.
Crude oil inputs to refineries decreased 236,000 barrels daily; there were 16.033 million barrels per day of crude oil run to facilities. Gross inputs, which include blending stocks, fell 112,000 barrels daily to 16.617 million barrels daily.
Total petroleum product inventories were plus 5.7 million barrels from the previous report week, rising to 740 million barrels.
Total product demand decreased 172,000 thousand barrels daily to 19.512 million barrels per day.
Gasoline stocks decreased 0.7 million barrels from the previous report week; total stocks are 219 million barrels.
Demand for gasoline grew 179,000 barrels per day to 8.977 million barrels per day.
Distillate fuel oil stocks decreased 0.5 million barrels from the previous report week; distillate stocks are at 106.4 million barrels. EIA reported national distillate demand at 3.969 million barrels per day during the report week, an increase of 102,000 barrels daily.
Propane stocks increased 3.2 million barrels from the previous report week; propane stocks are at 49.6 million barrels. The report estimated current demand at 621,000 barrels per day, a decrease of 12,000 barrels daily from the previous report week.
Natural Gas
Injections into underground storage last week failed last year’s level and that of the five-year average. It is part of a pattern of heavy US natural gas demand that led to the highest withdrawal in four years from storage last winter.

Winter Withdrawals – Natural Gas 2016 – 2022 Source: EIA
DOE reported 2.3 Tcf of natural gas withdrawn from storage last winter. This was 10% more than the five-year average withdrawal. Withdrawals are the net of demand (domestic consumption and exports) and supply (dry production of natural gas plus imports.)
Both measures of economic activity reached record levels last winter. Supply weighed in at 104.3 Bcf/d and demand at 119.2 Bcf/d, a net demand surplus of 14.9 Bcf/d.
Powerhouse has documented several reasons for this result, including major expansion of LNG exports, higher production in the Permian Basin and improved outtake capability in the Appalachian Mountains.
Production averaged 95.6 Bcf/d, nearly to the record 96 Bcf/d of 2019-2020. Output has not yet fully recovered to its pre-pandemic level.
Last winter’s consumption of natural gas reached 99.5 Bcf/d, just short of the 2018-2019 record. The main contribution to consumption growth was in electric poser generation, a gain of 2.0 Bcf/d over the prior winter. Higher heating degree days in January were another contributing factor. LNG exports added 1.8 Bcf/d to consumption as well.
According to the EIA:
Net injections into [natural gas] storage totaled 90 Bcf for the week ended May 27, compared with the five-year (2017–2021) average net injections of 100 Bcf and last year’s net injections of 100 Bcf during the same week. Working natural gas stocks totaled 1,902 Bcf, which is 337 Bcf lower than the five-year average and 397 Bcf lower than last year at this time.
The average rate of injections into storage is 10% lower than the five-year average so far in the refill season (April through October). If the rate of injections into storage matched the five-year average of 9 Bcf/d for the remainder of the refill season, the total inventory would be 3,308 Bcf on October 31, which is 337 Bcf lower than the five-year average of 3,645 Bcf for that time of year.
Was this helpful? We’d like your feedback.
Please respond to [email protected]
Powerhouse Futures & Trading Disclaimer
Copyright 2021 Powerhouse Brokerage, LLC, All rights reserved