Contradictory Market Data Complicates Price Analysis
- Higher crude oil availability meets higher gasoline prices
- Oil remains subject to geopolitical tensions
- Distillate shortfalls likely to move prices higher
- Natural gas injections topped 5-year average for third consecutive week

The Matrix
As U.S. motorists hit the road this Memorial Day Weekend—the unofficial beginning to the summer driving season—retail gasoline prices were the highest since 2014 and some 22 percent above a year ago. The higher gasoline price came while American crude oil output was rising, breaking records last seen in 1970. The United States produced over ten million barrels of crude oil per day in 2017. And government projects crude oil production reaching 11.3 million barrels daily by 2019.
This apparent contradiction –more feed-stock for gasoline and higher prices for gasoline — reminds us that petroleum supply and price have always been and continue to be creatures of geopolitical tensions. Adequate supply is not enough to assure lower prices. OPEC,for example, adds to production despite the apparent agreement to restrain production for reduction of global supply. Any net OPEC loss really comes from production challenges in member states, in particular Venezuela, Algeria, Qatar and Iran.
Saudi Arabia has a particular reason to seek higher oil prices. The Kingdom is expected to offer shares of Saudi Aramco for public sale. The higher the oil price the more attractive will shares of the first Initial Public Offering (IPO) be.
Changes in global demand can influence demand for feed-stocks. The first quarter of 2018 was probably the strongest for global oil demand, year-on-year, since the fourth quarter of 2010. And recently expanded exports of petroleum, both crude oil and products, helps reduce supply here in the United States
* * *
Analysts have expressed concern that middle distillate shortages could drive oil prices higher this year. Tight distillate supply can be attributed in part to shortfalls in refinery capacity. And such shortfalls reflect reluctance to invest in refining assets. Concerns over the impact of renewable fuels, emergence of electric vehicles and mounting front-end costs have inhibited refinery investment.
Growth in several economic sectors, including shipping, aviation and extractive industries should continue to support demand for distillate fuels. In particular, Latin America, India and the Mid-east are experiencing this growth.
Supply/Demand Balances
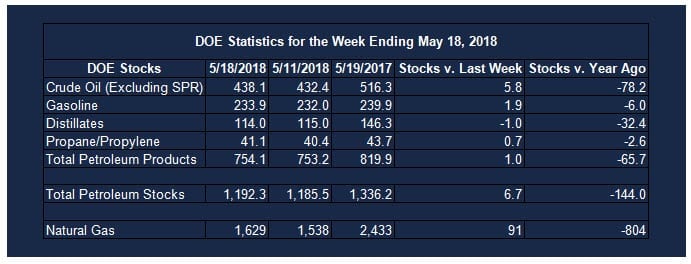
Supply/demand data in the United States for the week ending May 18, 2018 were released by the Energy Information Administration.
Total commercial stocks of petroleum rose 6.7 million barrels during the week ending May 18, 2018.
There were builds in stocks of gasoline, fuel ethanol, propane, and other oils. Draws were reported in stocks of K-jet fuel, distillate fuel, and residual fuel.
Commercial crude oil supplies in the United States increased to 438.1 million barrels, a build of 5.8 million barrels.
Crude oil supplies increased in two of the five PAD Districts. PAD District 1 (East Coast) stocks rose 3.4 million barrels and PADD 3 (Gulf Coast) stocks grew 3.2 million barrels. PADD 2 (Midwest) stocks declined 0.7 million barrels and PADD 4 (Rockies) stocks decreased 0.1 million barrels. Crude oil stocks at PADD 5 (West Coast) were unchanged from the previous report week.
Cushing, Oklahoma inventories were fell 1.1 million barrels from the previous report week to 36.1 million barrels.
Domestic crude oil production increased 2,000 barrels daily to 10.725 million barrels per day from the previous report week.
Crude oil imports averaged 8.159 million barrels per day, a daily increase of 558,000 barrels per day. Exports declined 818,000 barrels daily to 1.748 million barrels per day.
Refineries used 91.8 per cent of capacity, an increase of 0.7 percentage points from the previous report week.
Crude oil inputs to refineries decreased 7,000 barrels daily; there were 16.628 million barrels per day of crude oil run to facilities. Gross inputs, which include blending stocks, rose 132,000 barrels daily to 17.049 million barrels daily.
Total petroleum product inventories saw an increase of 0.9 million barrels from the previous report week.
Gasoline stocks rose 1.9 million barrels from the previous report week; total stocks are 233.9 million barrels.
Demand for gasoline increased 158,000 barrels per day to 9.689 million barrels daily.
Total product demand increased 126,000 barrels daily to 20.653 million barrels per day.
Distillate fuel oil supply declined 1.0 million barrels from the previous report week to 114.0 million barrels. National distillate demand was reported at 3.637 million barrels per day during the report week. This was a weekly decrease of 585,000 barrels daily.
Propane stocks increased 0.7 million barrels from the previous report week; propane stock are 41.1 million barrels. Current demand is estimated at 885,000 barrels per day, a decrease of 117,000 barrels daily from the previous report week.
Natural Gas
According to the Energy Information Administration:
Net injections topped the 5-year average for the third week in a row. Net injections into storage totaled 91 Bcf for the week ending May 18, compared with the five-year (2013–17) average net injections of 89 Bcf and last year’s net injections of 74 Bcf during the same week.
Net injections during the week averaged 13.2 Bcf/day; net injections will have to average 13.1 Bcf/day for the remainder of the refill season to match the five-year average level (3,815 Bcf) by October 31. Working gas stocks totaled 1,629 Bcf, which is 499 Bcf lower than the five-year average and 804 Bcf lower than last year at this time. The deficit to the five-year average peaked at 534 Bcf earlier this year during the week ending April 20.
Futures trading involves significant risk and is not suitable for everyone. Transactions in securities futures, commodity and index futures and options on future markets carry a high degree of risk. The amount of initial margin is small relative to the value of the futures contract, meaning that transactions are heavily “leveraged”. A relatively small market movement will have a proportionately larger impact on the funds you have deposited or will have to deposit: this may work against you as well as for you. You may sustain a total loss of initial margin funds and any additional funds deposited with the clearing firm to maintain your position. If the market moves against your position or margin levels are increased, you may be called upon to pay substantial additional funds on short notice to maintain your position. If you fail to comply with a request for additional funds within the time prescribed, your position may be liquidated at a loss and you will be liable for any resulting deficit. Past performance may not be indicative of future results. This is not an offer to invest in any investment program.
Powerhouse is a registered affiliate of Coquest, Inc.
Was this helpful? We’d like your feedback.
Please respond to [email protected]
Copyright © 2018 Powerhouse


