Price Strength Supported by Backwardation
- WTI price exceeds $70 for first time since January 2015
- Backwardation of $10 over two years seen as bullish
- Middle East tensions are bullish for crude oil
- Natural gas injections in May top 100 Bcf first time since 2015

The Matrix
Price strength continues to characterize the post-Iranian-sanctions era. Indeed, crude oil prices have shown strength from a time well before the United States’ reestablishment of barriers to trade by imposing limits on Iranian crude oil exports. WTI has moved over $70 and shows very little inclination to retreat.
Crude oil prices along the forward price curve exhibit backwardation – more current prices are more expensive than more distant prices. June 2018 traded at 71.35 as the week ended on May 18 while June 2019 crude oil was valued at 66.17 — $5.18 cheaper.
June of 2020 had crude oil valued at $61.45 – a discount from current values of nearly $10.00. Lower prices in more distant months are bullish indicators.
Logically, one might think that more distant valuations would be more expensive because of the costs of storage. When that does not happen – as is the case now, — the market is said to be “backwardated.”
Crude oil is backwardated just now. This reflects concerns that current events could interfere with crude oil supply in the near term. Particularly, tension between Iran and Saudi Arabia appears in surrogate conflicts in Syria or Yemen. Nonetheless, the possibility of expanding hostilities applies upward price pressure.
Should concerns over the Middle East persist, one could expect backwardation to remain a feature of the oil markets. An easing of tensions could have the opposite impact. Purchasing June 2020 crude oil futures would establish a heavily discounted position with room to rally.
Newly permitted exports are another reason to be bullish on prices. More than two million barrels of crude are exported daily. Shipping costs are an essential component of the difference between WTI and Brent. Very roughly, shipping costs run about $5.00. Any larger discount for American oils could provide a powerful incentive for added exports. It would be price-support level.
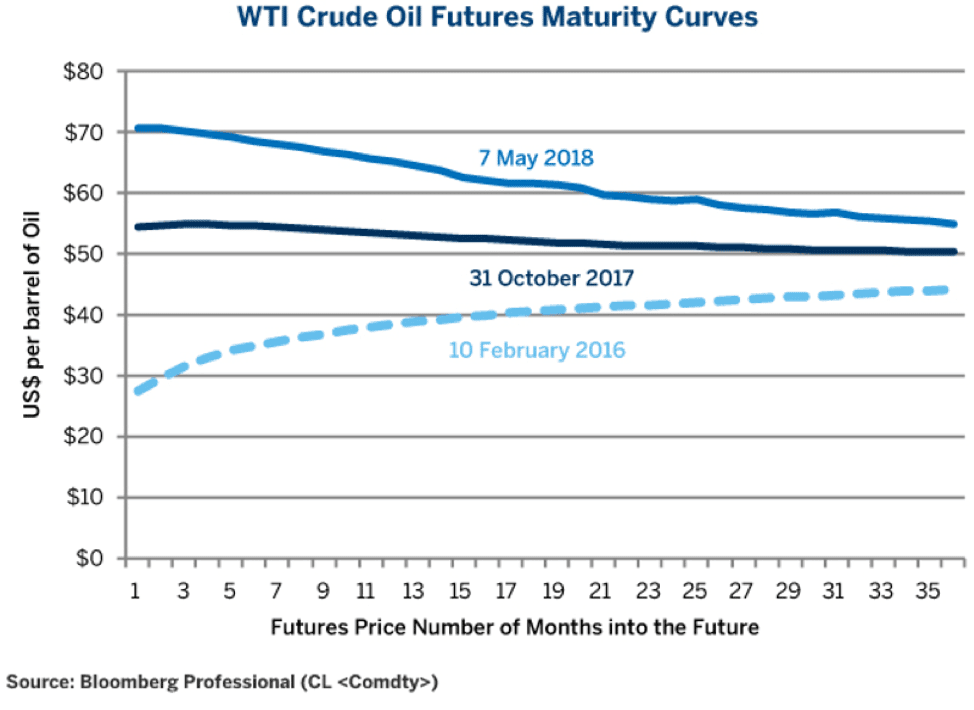
WTI Crude Oil Futures: Maturite Curves, Feb 2016 – May 2018
Source: Bloomberg Professional
Supply/Demand Balances
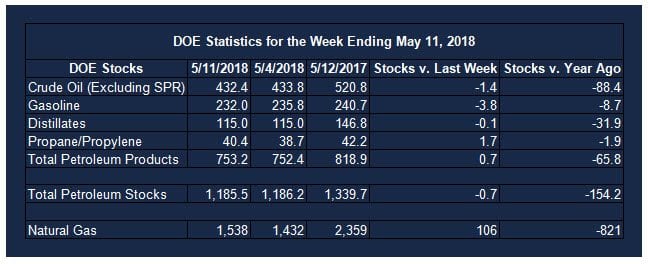
Supply/demand data in the United States for the week ending May 11, 2018 were released by the Energy Information Administration.
Total commercial stocks of petroleum fell 0.7 million barrels during the week ending May 11, 2018.
There were draws in stock of gasoline, fuel ethanol, distillate fuel oil, and residual fuel oil. Inventory builds were reported in stocks of K-jet fuel, propane, and other oils.
Commercial crude oil supplies in the United States decreased to 432.4 million barrels, a draw of 1.4 million barrels.
Crude oil supplies decreased in two of the five PAD Districts. PAD District 1 (East Coast) stocks fell 2.4 million barrels, PADD 3 (Gulf Coast) stocks declined 1.5 million barrels. PADD 2 (Midwest) stocks rose 0.8 million barrels, PADD 4 (Rockies) stocks increased 0.2 million barrels, and PADD 5 (West Coast) stocks advanced 1.5 million barrels.
Cushing, Oklahoma inventories were unchanged from the previous report week at 37.2 million barrels.
Domestic crude oil production increased 20,000 barrels daily to 10.723 million barrels per day from the previous report week.
Crude oil imports averaged 7.601 million barrels per day, a daily increase of 278,000 barrels per day. Exports rose 689,000 barrels daily to 2.566 million barrels per day.
Refineries used 91.1 per cent of capacity, an increase of 0.7 percentage points from the previous report week.
Crude oil inputs to refineries increased 149,000 barrels daily; there were 16.635 million barrels per day of crude oil run to facilities. Gross inputs, which include blending stocks, rose 125,000 barrels daily to 16.917 million barrels daily.
Total petroleum product inventories saw an increase of 0.7 million barrels from the previous report week.
Gasoline stocks fell 3.8 million barrels from the previous report week; total stocks are 232.0 million barrels.
Demand for gasoline fell 244,000 barrels per day to 9.531 million barrels daily.
Total product demand decreased 21,000 barrels daily to 20.527 million barrels per day.
Distillate fuel oil supply declined 0.1 million barrels from the previous report week to 114.9 million barrels. National distillate demand was reported at 4.222 million barrels per day during the report week. This was a weekly decrease of 84,000 barrels daily.
Propane stocks increased 1.7 million barrels from the previous report week; propane stock are 40.4 million barrels. Current demand is estimated at 1.002 barrels per day, an increase of 25,000 barrels daily from the previous report week.
Natural Gas
According to the Energy Information Administration:
Net injections topped the 100 Bcf threshold in May for the first time since 2015. Net injections into storage totaled 106 Bcf for the week ending May 11, compared with the five-year (2013–17) average net injection of 87 Bcf and last year’s net injections of 64 Bcf during the same week.
This report week had the largest reported May weekly net injection since May 29, 2015, when net injection reached its record high of 132 Bcf. Net injections during the week averaged 15.1 Bcf/day; net injections will have to average 13.1 Bcf/day for the remainder of the refill season to match the five-year average level (3,806 Bcf) by October 31. Working gas stocks totaled 1,538 Bcf, which is 501 Bcf lower than the five-year average and 821 Bcf lower than last year at this time.
Futures trading involves significant risk and is not suitable for everyone. Transactions in securities futures, commodity and index futures and options on future markets carry a high degree of risk. The amount of initial margin is small relative to the value of the futures contract, meaning that transactions are heavily “leveraged”. A relatively small market movement will have a proportionately larger impact on the funds you have deposited or will have to deposit: this may work against you as well as for you. You may sustain a total loss of initial margin funds and any additional funds deposited with the clearing firm to maintain your position. If the market moves against your position or margin levels are increased, you may be called upon to pay substantial additional funds on short notice to maintain your position. If you fail to comply with a request for additional funds within the time prescribed, your position may be liquidated at a loss and you will be liable for any resulting deficit. Past performance may not be indicative of future results. This is not an offer to invest in any investment program.
Powerhouse is a registered affiliate of Coquest, Inc.
Was this helpful? We’d like your feedback.
Please respond to [email protected]
Copyright © 2018 Powerhouse, All rights reserved.