May ULSD Futures End in Chaos
- Spot ULSD loses 6 percent of value as trading ends.
- June ULSD lags May close by $0.7645
- Motor gasoline stocks will open drive season with short stocks
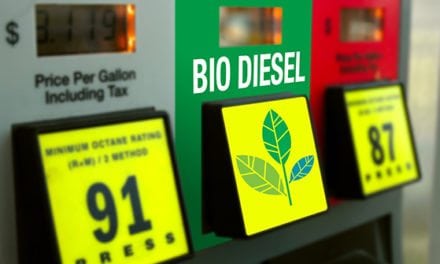
- Uncertainty clouds LNG future in Europe
Sincerely,
Alan Levine, Chairman
Powerhouse
(202) 333-5380

The Matrix
The May ULSD futures contract ended its life on April 29, 2022, at $4.7817. Last-day behavior was chaotic, following the pattern of a commodity in short supply and an economy facing the uncertainty of recession.
This writer has watched the ULSD futures market since its opening in 1978. There have been many contract closings reacting wildly to events– the overthrow of the Shah of Iran in 1979, Saddam Hussein’s attack on Kuwait in 1990, the recession in 2008, and the 2020 demand decline because of the coronavirus pandemic.
Last week’s ULSD closing surely ranks with these similar events in the past. Just before the close (beginning at 2 pm,) ULSD May futures reached $5.8595, a record high for the ULSD contract. In the last half-hour (the closing range) prices collapsed, moving from $5.6000 to $4.4192. This loss, during the close, of $1.1808 translated into a 21% loss of value.
The market traded in low volume, adding to the volatility. Tighter margin controls, discussed here in recent weeks, contributed to the low volumes.
June ULSD futures settled at $4.0172, $0.7645 below May, leaving a substantial gap. That difference might not be closed in the days ahead, reflecting the already weakened basis and the end of winter’s demand.
Nonetheless, the United States has become a large supplier of oil to global markets, replacing Russian exports lost to sanctions on its supplies. National supplies remain well below their historical levels. And inventories are still trending down. The chart of ULSD stocks shows this clearly.

ULSD Fuel Stocks – 5-year Trend 2017 – Apr 2022 Source: EIA, POWERHOUSE
The U.S. driving season typically starts on Memorial Day, only a few weeks from now. Inventories of motor gasoline seem to be better than ULSD but are themselves near the bottom of the five-year range.
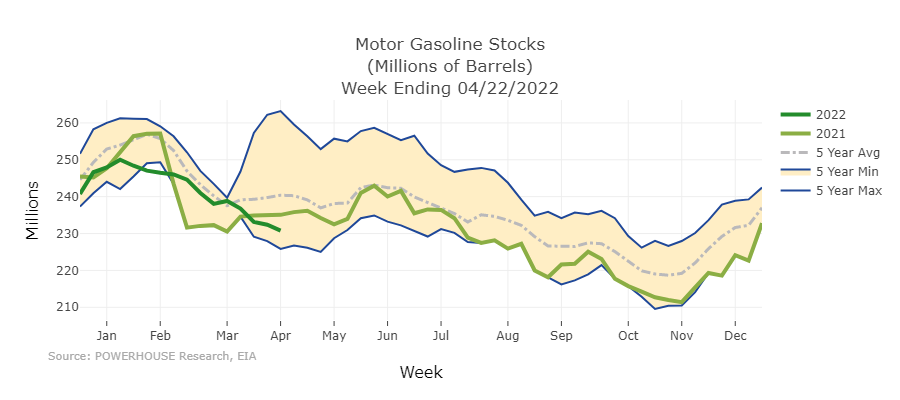
Motor Gasoline Stocks – 5-year Trend 2017 – Apr 2022 Source: EIA, POWERHOUSE
Supply/Demand Balances
Supply/demand data in the United States for the week ended April 22, 2022, were released by the Energy Information Administration.
Total commercial stocks of petroleum rose 0.7 million barrels during the week ended April 22, 2022.
Commercial crude oil supplies in the United States increased by 0.7 million barrels from the previous report week to 414.4 million barrels.
Crude oil inventory changes by PAD District:
PADD 1: Plus 1.2 million barrels to 8.5 million barrels
PADD 2: Plus 0.1 million barrels to 105.9 million barrels
PADD 3: Down 0.8 million barrels to 228.3 million barrels
PADD 4: Down 0.9 million barrels 23.7 million barrels
PADD 5: Plus 1.0 million barrels to 48.0 million barrels
Cushing, Oklahoma, inventories were plus 1.3 million barrels from the previous report week to 27.5 million barrels.
Domestic crude oil production was UNCH from the previous report week at 11.9 million barrels daily.
Crude oil imports averaged 5.934 million barrels per day, a daily increase of 98,000 barrels. Exports decreased 549,000 barrels daily to 3.721 million barrels per day.
Refineries used 90.3% of capacity; 0.7 percentage points lower from the previous report week.
Crude oil inputs to refineries decreased 33,000 barrels daily; there were 15.684 million barrels per day of crude oil run to facilities. Gross inputs, which include blending stocks, fell 137,000 barrels daily to 16.195 million barrels daily.
Total petroleum product inventories were net unchanged from the previous report week.
Gasoline stocks decreased 1.6 million barrels from the previous report week; total stocks are 233.1 million barrels.
Demand for gasoline fell by 129,000 barrels per day to 8.739 million barrels per day.
Total product demand increased 788,000 million barrels daily to 19.821 million barrels per day.
Distillate fuel oil stocks decreased 1.4 million barrels from the previous report week; distillate stocks are at 107.3 million barrels. EIA reported national distillate demand at 3.834 million barrels per day during the report week, an increase of 11,000 barrels daily.
Propane stocks increased 2.2 million barrels from the previous report week; propane stocks are at 39.2 million barrels. The report estimated current demand at 0.864 million barrels per day, a decrease of 219,000 barrels daily from the previous report week.
Natural Gas
The buzz over the expansion of U.S. exports of LNG to the European Union has been supported by EIA’s forecast that the country will export 12.2 Bcf/d in 2022. This will make the country the leading exporter, moving over Australia and Qatar.
European need to replace Russian natural gas has accelerated the outflow. The EU received 65% of American LNG exports so far this year. Exports traditionally moved to Asia – Japan, China, and Korea.
Shale gas induced much new drilling. The United States today has plenty of natural gas available for export. U.S. capacity could reach 13.9 Bcf/d.
The future for LNG in the EU remains under a cloud. European environmental groups are resisting gas use. Natural gas also inhibits the region’s goal of climate neutrality by 2050. In the near term, however, the Baltic States, Finland, and Germany are moving forward with new LNG import facilities.
According to the EIA:
The net injections into storage totaled 40 Bcf for the week ended April 22, compared with the five-year (2017–2021) average net injections of 53 Bcf and last year’s net injections of 18 Bcf during the same week. Working natural gas stocks totaled 1,490 Bcf, which is 305 Bcf lower than the five-year average and 406 Bcf lower than last year at this time.
Was this helpful? We’d like your feedback.
Please respond to [email protected]
Powerhouse Futures & Trading Disclaimer
Copyright 2021 Powerhouse Brokerage, LLC, All rights reserved