New EIA Analysis on Supply & Demand Trends for Refined Products
- EIA analysis often helps to inform market consensus view
- U.S. transportation fuel inventories expected to tighten over the next two years
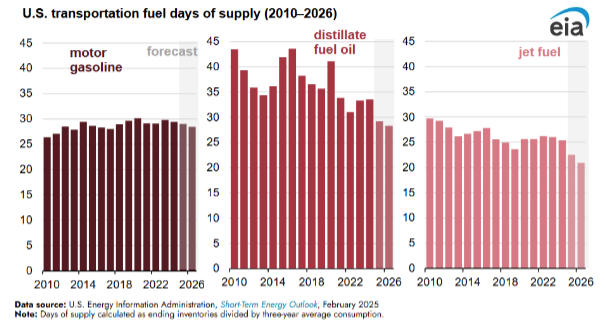
- Changes in days of supply vary by fuel type
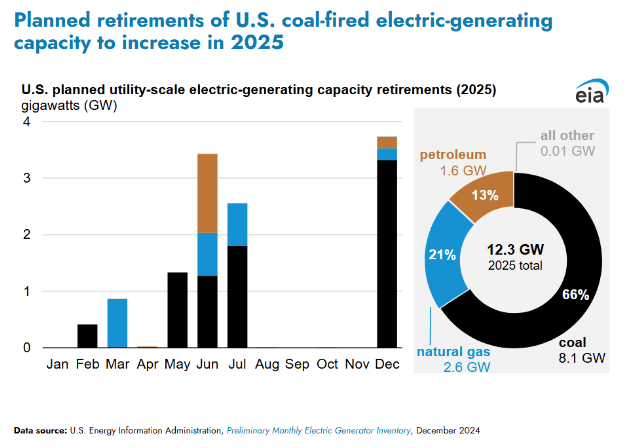
- Retirement of coal-fired power plants increases
Sincerely,
David Thompson, CMT
Executive Vice President
Powerhouse
(202) 333-5380

The Matrix
The EIA recently released long term analysis that may help set some of the market consensus going forward over the next two years. Between now and the end of 2026, EIA forecasts that inventories of the three largest transportation fuels (gasoline, distillate and jet fuel) will fall to levels not seen since 2000. Two U.S. refineries are set to close over this time period.
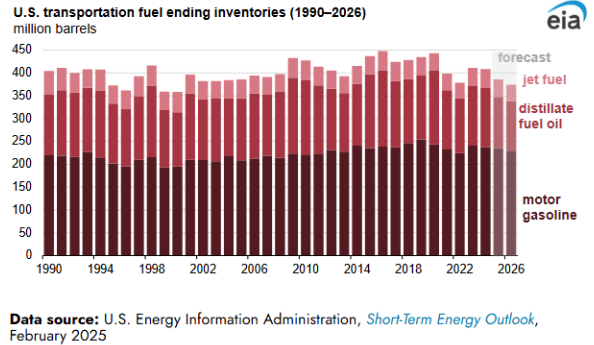
However, less gasoline output from refineries will be largely offset by improved fuel efficiency and less employment growth. EIA forecasts that gasoline demand will remain unchanged in 2025 but decline by approximately 1% in 2026.
The distillate market offers a contrast. Even with more renewable diesel becoming available, the days of supply calculation for distillate fuels is expected to continue to decline noticeably over the next two years. The EIA calculates days of supply as current inventory divided by the previous three-year average rate of consumption.
The EIA believes jet fuel will face the tightest supply & demand conditions of the three major transportation fuels. U.S. jet fuel consumption is expected to reach all-time highs in 2026, and days of supply may reach levels not seen since 1963.
All of this information represents the current EIA forecast and is by no means guaranteed to be fact in the next two years. However, markets often move when a critical statistic deviates from consensus expectations. The viewpoints of the EIA are certainly a key part of the energy market consensus.
Supply/Demand Balances
Supply/demand data in the United States for the week ending February 21, 2025, were released by the Energy Information Administration.
Total commercial stocks of petroleum decreased (⬇) 2.2 million barrels to 1.2098 billion barrels during the week ending February 21st, 2025.
Commercial crude oil supplies in the United States were lower (⬇) by 2.3 million barrels from the previous report week to 430.2 million barrels.
Crude oil inventory changes by PAD District:
PADD 1: Down (⬇) 1.1 million barrels to 6.9 million barrels
PADD 2: Up (⬆) 1.6 million barrels to 107.4 million barrels
PADD 3: Down (⬇) 4.1 million barrels to 243.2 million barrels
PADD 4: Down (⬇) 0.1 million barrels to 24.6 million barrels
PADD 5: Up (⬆) 1.5 million barrels to 48.1 million barrels
Cushing, Oklahoma, inventories were up (⬆) 1.3 million barrels to 24.6 million barrels.
Domestic crude oil production increased (⬆) 5,000 barrels per day from the previous report at 13.502 million barrels per day.
Crude oil imports averaged 5.919 million barrels per day, a daily increase (⬆) of 98,000 barrels. Exports decreased (⬇) 193,000 barrels daily to 4.188 million barrels per day.
Refineries used 86.5 percent of capacity; an increase (⬆) of 1.6 percent from the previous report week.
Crude oil inputs to refineries increased (⬆) 317,000 barrels daily; there were 15.733 million barrels per day of crude oil run to facilities. Gross inputs, which include blending stocks, increased (⬆) 291,000 barrels daily to 15.880 million barrels daily.
Total petroleum product inventories remained unchanged (=) at 779.6 million barrels.
Total product demand increased (⬆) 1,189,000 barrels daily to 20.842 million barrels per day.
Gasoline stocks increased (⬆) 0.4 million barrels from the previous report week; total stocks are 248.3 million barrels.
Demand for gasoline increased (⬆) 215,000 barrels per day to 8.454 million barrels per day.
Distillate fuel oil stocks increased (⬆) 3.9 million barrels from the previous report week; distillate stocks are at 120.5 million barrels. EIA reported national distillate demand at 4.097 million barrels per day during the report week, a decrease (⬇) of 268,000 barrels daily.
Propane stocks fell (⬇) 3.7 million barrels from the previous report to 51.5 million barrels. The report estimated current demand at 1,918,000 barrels per day, an increase (⬆) of 596,000 barrels daily from the previous report week.
Natural Gas
Much has been written about AI’s demand for electricity. Rightfully, much consideration has been given to how much this may increase the call on natural gas as fuel for power generation.
A more familiar source of increased natural gas demand is set to increase in 2025. The EIA forecasts that planned retirements of coal and oil-fired powerplants is set to increase in 2025. Electricity generators plan to retire 12.3 gigawatts of capacity in 2025, a 65% increase over 2024. Coal-fired power plants account for two thirds of this total.
Believe it or not, petroleum-fired power plants still make up a little over 2% of U.S. generating capacity. This year, large oil-fired power plants in Maryland and Tennessee will close bringing the percentage ever closer to zero.
According to the EIA:
- Net withdrawals from storage totaled 261 Bcf for the week ending February 21, compared with the five-year (2020–24) average net withdrawals of 141 Bcf and last year’s net withdrawals of 86 Bcf during the same week. Working natural gas stocks totaled 1,840 Bcf, which is 238 Bcf (11%) lower than the five-year average and 561 Bcf (23%) lower than last year at this time.
- According to The Desk survey of natural gas analysts, estimates of the weekly net change to working natural gas stocks ranged from net withdrawals of 240 Bcf to 282 Bcf, with a median estimate of 266 Bcf.
- The average rate of withdrawals from storage is 27% higher than the five-year average so far in the withdrawal season (November through March). If the rate of withdrawals from storage matched the five-year average of 5.7 Bcf/d for the remainder of the withdrawal season, the total inventory would be 1,622 Bcf on March 31, which is 238 Bcf lower than the five-year average of 1,860 Bcf for that time of year.
Was this helpful? We’d like your feedback.
Please respond to [email protected]
This material has been prepared by a sales or trading employee or agent of Powerhouse Brokers, LLC and is, or is in the nature of, a solicitation. This material is not a research report prepared by Powerhouse Brokers, LLC. By accepting this communication, you agree that you are an experienced user of the futures markets, capable of making independent trading decisions, and agree that you are not, and will not, rely solely on this communication in making trading decisions.
DISTRIBUTION IN SOME JURISDICTIONS MAY BE PROHIBITED OR RESTRICTED BY LAW. PERSONS IN POSSESSION OF THIS COMMUNICATION INDIRECTLY SHOULD INFORM THEMSELVES ABOUT AND OBSERVE ANY SUCH PROHIBITION OR RESTRICTIONS. TO THE EXTENT THAT YOU HAVE RECEIVED THIS COMMUNICATION INDIRECTLY AND SOLICITATIONS ARE PROHIBITED IN YOUR JURISDICTION WITHOUT REGISTRATION, THE MARKET COMMENTARY IN THIS COMMUNICATION SHOULD NOT BE CONSIDERED A SOLICITATION.
The risk of loss in trading futures and/or options is substantial and each investor and/or trader must consider whether this is a suitable investment. Past performance, whether actual or indicated by simulated historical tests of strategies, is not indicative of future results. Trading advice is based on information taken from trades and statistical services and other sources that Powerhouse Brokers, LLC believes are reliable. We do not guarantee that such information is accurate or complete and it should not be relied upon as such. Trading advice reflects our good faith judgment at a specific time and is subject to change without notice. There is no guarantee that the advice we give will result in profitable trades.
Copyright 2025 Powerhouse Brokers, LLC, All rights reserved