Petroleum Inventories Fall; Oil Price Changes Mixed
- Inventories of oil in US lose 10.4 million barrels
- Gasoline stocks move below 5-year historic low
- RBOB price charts indecisive
- Warm weather inhibits Heating Degree Day growth
Sincerely,
Alan Levine, Chairman
Powerhouse
(202) 333-5380

The Matrix
A bullish inventory report for the week ending March 17, 2023, was not enough to ignite the spring gasoline rally that is usually, by now, well underway. Petroleum supplies lost 10.4 million barrels during the week, with reductions in inventories of motor gasoline and distillate fuel oil of 6.4 and 3.3 million barrels respectively. (Propane stocks fell too, some 2.3 million barrels.)
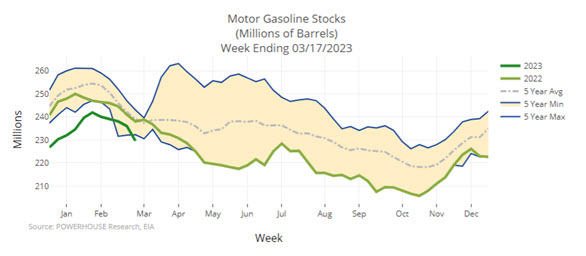
Gasoline stocks have fallen below their five-year minimum level. Tight inventories are bullish. This has not been apparent in RBOB price action. Monthly technical charts of the spot RBOB futures contract are indecisive. The monthly chart shows prices of RBOB hovering just above $2.40 for several months since late September 2022. In March, prices have advanced, but a doji candlestick, evidence of market indecision, is clear.
The difficulty in interpreting these data is that U.S. demand for gasoline has shown strength. The U.S. Petroleum Balance Sheet for the week ending March 17, rose to just under nine million barrels per day, a weekly gain of 366,000 barrels daily. Total demand for petroleum products exceeded 20 million barrels daily for the week.
This is contradictory to a national financial house’s decision to reduce its crude oil price projection for Brent crude oil. Reported in opisnet, “The bank has reduced its target for Brent crude to $94/barrel over the next 12 months and sees $97/barrel in the second half of 2024. Both time horizons had previously featured $100/barrel targets.”
This reduction translates to a $5.30 discount to Brent per barrel for WTI crude oil this year. In March thus far, WTI spot futures have fallen $7.70 per barrel, settling on Friday at $69.26. The bank’s reduction in crude oil price is a reaction to recent “scarring events.”
As elsewhere in the economy, petroleum data tell a complex and often contradictory story. Possible business contraction, but a growth in demand. Expanding refinery operations, but reductions in inventory. This is discussed further in the Natural Gas analysis below.
Supply/Demand Balances
Supply/demand data in the United States for the week ending March 17, 2023, were released by the Energy Information Administration.
Total commercial stocks of petroleum fell (⬇) 10.4 million barrels to 1.248 billion barrels during the week ending March 17, 2023.
Commercial crude oil supplies in the United States were higher (⬆) by 1.1 million barrels from the previous report week to 481.2 million barrels.
Crude oil inventory changes by PAD District:
PADD 1: Down (⬇) 0.1 million barrels to 6.5 million barrels
PADD 2: Down (⬇) 1.8 million barrels to 123.2 million barrels
PADD 3: Plus (⬆) 1.6 million barrels to 275.2 million barrels
PADD 4: Plus (⬆) 0.4 million barrels to 25.4 million barrels
PADD 5: Down (⬇) 0.1 million barrels to 50.8 million barrels
Cushing, Oklahoma, inventories were up down (⬇) 1.1 million barrels from the previous report week to 36.8 million barrels.
Domestic crude oil production was up (⬆) from the previous report week at 12.3 million barrels daily.
Crude oil imports averaged 6.172 million barrels per day, a daily decrease (⬇) of 45,000 barrels. Exports decreased (⬇) 95,000 barrels daily to 4.932 million barrels per day.
Refineries used 88.6% of capacity; 0.4 percentage points higher (⬆) than the previous report week.
Crude oil inputs to refineries decreased (⬇) 21,000 barrels daily; there were 15.376 million barrels per day of crude oil run to facilities. Gross inputs, which include blending stocks, rose (⬆) 61,000 barrels daily to 15.946 million barrels daily.
Total petroleum product inventories fell (⬇) by 11.5 million barrels from the previous report week, falling to 766.8 million barrels.
Total product demand increased (⬆) 913,000 barrels daily to 20.026 million barrels per day.
Gasoline stocks decreased (⬇) 6.4 million barrels from the previous report week; total stocks are 229.6 million barrels.
Demand for gasoline increased (⬆) 366,000 barrels per day to 8.960 million barrels per day.
Distillate fuel oil stocks decreased (⬇) 3.3 million barrels from the previous report week; distillate stocks are at 116.4 million barrels. EIA reported national distillate demand at 3.974 million barrels per day during the report week, an increase (⬆) of 238,000 barrels daily.
Propane stocks decreased (⬇) by 2.3 million barrels from the previous report week to 58.7 million barrels. The report estimated current demand at 1.034 million barrels per day, an increase (⬆) of 321,000 barrels daily from the previous report week.
Gasoline stocks decreased (⬇) 6.4 million barrels from the previous report week; total stocks are 229.6 million barrels.
Natural Gas
Natural gas consumption in the United States in January and February, year-on-year, reached five-year lows. This reflected, of course, weather that did not generate Heating Degree Days sufficient to support higher demand.
Ironically, temperatures in the western U.S. fell as one of the region’s coldest winters in years took hold. The West relies less on natural gas for space heating than elsewhere in America. (The cold was reflected in regional electric generation. Natural gas use in the power sector was 33% higher in the first two months of the year than during the same time period over the past five years.)
Indeed, the western regions of the country have been the only ones to develop significant heating degree days – and, as noted, the ones with the least natural gas consumption. The Pacific region accumulated 18% more HDDs than last year (since July 2022.) Lower HDD generation measured around 5% in New England and the Middle Atlantic States. These two regions produced around 15% fewer HDDs than over the normal, long-term period.
The lower rate of HDD development shows in the underground storage data. Stocks are 36% higher than last year at this time. Spot natural gas futures prices have been tracing a very flat-to-lower pattern in March.
Seasonality and shifts in LNG demand may limit bullish impulses in natural gas pricing. The war in Ukraine is grinding along, showing little decisive action on either side.
Early concern among governments about sufficiency of supply to Europe has been alleviated by diversion of cargos to the EU from other destinations, particularly from poorer nations without the funds needed to compete for LNG.
Anxiety over the direction of the economy has not been eased by recent Federal Reserve action that raised core interest rates by less than expected. Economic growth appears to have bested fighting inflation. Near-term market satisfaction feels good and kicks the inflation can-as-its-own-tax down the road.
According to the EIA:
Net withdrawals from storage totaled 72 Bcf for the week ending March 17, compared with the five-year (2018–2022) average net withdrawals of 45 Bcf and last year’s net withdrawals of 55 Bcf during the same week. Working natural gas stocks totaled 1,900 Bcf, which is 351 Bcf (23%) more than the five-year average and 504 Bcf (36%) more than last year at this time.
The average rate of withdrawals from storage is 22% lower than the five-year average so far in the withdrawal season (November through March). If the rate of withdrawals from storage matched the five-year average of 1.2 Bcf/d for the remainder of the withdrawal season, the total inventory would be 1,883 Bcf on March 31, which is 351 Bcf higher than the five-year average of 1,532 Bcf for that time of year.
Was this helpful? We’d like your feedback.
Please respond to [email protected]
Powerhouse Futures & Trading Disclaimer
Copyright 2023 Powerhouse Brokerage, LLC, All rights reserved