Geopolitics Heighten Uncertainty in Oil Pricing
- U.S. crude oil output reaches new highs
- Hawkish presidential advisors could change price expectations
- Saudi Arabia supports price in service to its Aramco IPO
- Natural gas challenging support at $2.53
Sincerely, Alan Levine, Chairman of Powerhouse (202) 333-5380

The Matrix
U.S. production of crude oil continues to barrel ahead. In the EIA weekly supply/demand report for the week ending March 16th, crude oil output reached a new high in the current expansion. Some analysts regard this as bearish, with growing inventories leading to lower prices later this year. And this bearish expectation has led to a certain indifference among traders despite prices moving insistently higher.
Expectations of even greater volumes of production could be expected to put a brake on further price advances. The U.S. EIA now projects total oil output to reach 18.4 million barrels per day by the end of this year.
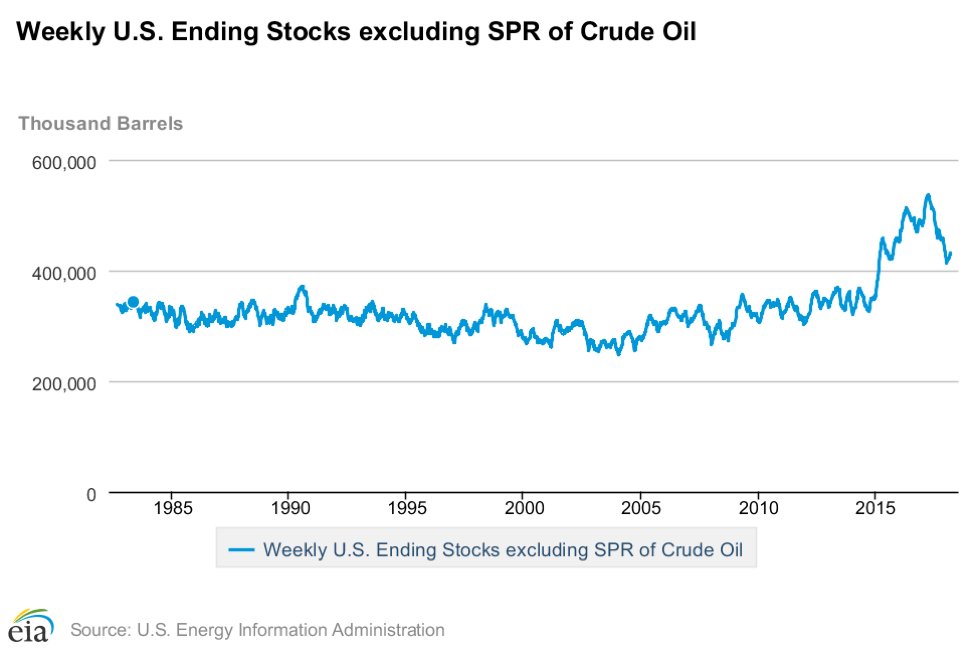
U.S. stocks of crude oil have been falling in recent months.
Price strength in the United States can be attributed to significant consumption, drains on supply from expanding exports and an unprecedented level of discipline among OPEC members in restraining output.
Political events in the United States have contributed to great uncertainty. Imposition of tariffs on many trading partners and the appearance of far more hawkish presidential advisors are new question marks that could translate into further price strength. (Although actual combat could suppress prices reflecting reduced levels of business activity.)
The expectation that domestic oil production might reduce the impact of foreign geopolitical activity on U.S. prices has run into reality. OPEC members now expect output cuts to extend into 2019. This reflects an interest in reducing global inventories to support prices. (OPEC uses the five-year average inventory level to define its desired level of supply.)
A more immediate reason that Saudi Arabia in particular seeks higher prices is the outlook for its expected public sale of up to five per cent of Saudi Aramco. One analysis estimates that a successful IPO could give Aramco a valuation of up to $2 trillion.
Added uncertainties surround the U.S. position on Iran and Venezuela. The accession of a new Secretary of State introduces the question of whether the U.S. would exit the current nuclear agreement with Iran causing a re-imposition of sanctions on production. He also reportedly supports more sanctions on Venezuela. One estimate puts the amount of oil taken from the market by these events at 1.4 million barrels daily.
Supply/Demand Balances
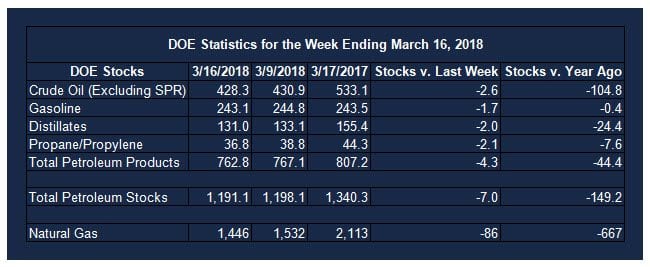
Supply/demand data in the United States for the week ending March 16, 2018 were released by the Energy Information Administration.
Total commercial stocks of petroleum fell 6.9 million barrels during the week ending March 16, 2018.
There were draws in stocks of gasoline, fuel ethanol, K-jet fuel, distillates, residual fuel, and propane. A build was reported in stocks of other oils.
Commercial crude oil supplies in the United States decreased to 428.3 million barrels, a draw of 2.6 million barrels.
Crude oil supplies increased in three of the five PAD Districts. PAD District 1 (East Coast) crude oil stocks rose 0.1 million barrels, PADD 2 (Midwest) crude stocks advanced 1.9 million barrels, and PADD 4 (Rockies) stocks climbed 0.3 million barrels. PADD 3 (Gulf Coast) stocks declined 3.6 million barrels and PADD 5 (West Coast) stocks fell 1.2 million barrels.
Cushing, Oklahoma inventories increased 0.9 million barrels from the previous report week to 29.4 million barrels.
Domestic crude oil production increased 26,000 barrels daily to 10.407 million barrels per day from the previous report week.
Crude oil imports averaged 7.077 million barrels per day, a daily decrease of 508,000 barrels. Exports rose 86,000 barrels daily to 1.573 million barrels per day.
Refineries used 91.7 per cent of capacity, an increase of 1.7 percentage points from the previous report week.
Crude oil inputs to refineries increased 410,000 barrels daily; there were 16.777 million barrels per day of crude oil run to facilities. Gross inputs, which include blending stocks, rose 321,000 barrels daily to 17.008 million barrels daily.
Total petroleum product inventories saw a decrease of 4.3 million barrels from the previous report week.
Gasoline stocks decreased 1.7 million barrels from the previous report week; total stocks are 243.1 million barrels.
Demand for gasoline fell 319,000 barrels per day to 9.324 million barrels daily.
Total product demand decreased 256,000 barrels daily to 20.675 million barrels per day.
Distillate fuel oil supply fell 2.0 million barrels from the previous report week to 131.0 million barrels. National distillate demand was reported at 3.917 million barrels per day during the report week. This was a weekly increase of 85,000 barrels daily.
Propane stocks decreased 2.1 million barrels from the previous report week to 36.8 million barrels. Current demand is estimated at 1.242 million barrels per day, a decrease of 306,000 barrels daily from the previous report week.
Natural Gas
According to the Energy Information Administration:
Working gas net withdrawals are 32 Bcf higher than the five-year average. Net withdrawals from storage totaled 86 Bcf for the week ending March 16, compared with the five-year (2013–17) average net withdrawal of 53 Bcf and last year’s net withdrawals of 137 Bcf during the same week. Working gas stocks totaled 1,446 Bcf, which is 329 Bcf lower than the five-year average and 667 Bcf lower than last year at this time.
Working gas levels are on pace to end the 2017–18 heating season at the second-lowest level since 2010. Working gas stocks have rebounded since falling to 59 Bcf lower than the five-year minimum range and 486 Bcf lower than the five-year average for the Lower 48 states on January 19, 2018. If net withdrawals from working gas stocks match the five-year average for the remainder of the withdrawal season, working gas stocks will total 1,373 Bcf by March 31, 2018, which is 19% lower than the five-year average. Working gas stocks ended the 2013–14 heating season at 837 Bcf, which is the lowest reported level for that time since 2010.
A relatively low level of end-of-heating-season natural gas stocks has not supported prices. The CFTC’s weekly Commitments of Traders showed increased short sales of 14.3 thousand contracts. Natural gas futures are moving toward a double bottom around $2.53, last seen on February 15, 2018. This general support level has appeared several times since June 2016. A break of $2.53 opens the way to new support at $2.20.
Futures trading involves significant risk and is not suitable for everyone. Transactions in securities futures, commodity and index futures and options on future markets carry a high degree of risk. The amount of initial margin is small relative to the value of the futures contract, meaning that transactions are heavily “leveraged”. A relatively small market movement will have a proportionately larger impact on the funds you have deposited or will have to deposit: this may work against you as well as for you. You may sustain a total loss of initial margin funds and any additional funds deposited with the clearing firm to maintain your position. If the market moves against your position or margin levels are increased, you may be called upon to pay substantial additional funds on short notice to maintain your position. If you fail to comply with a request for additional funds within the time prescribed, your position may be liquidated at a loss and you will be liable for any resulting deficit. Past performance may not be indicative of future results. This is not an offer to invest in any investment program.
Powerhouse is a registered affiliate of Coquest, Inc.
Was this helpful? We’d like your feedback.
Please respond to [email protected]
Copyright © 2018 Powerhouse, All rights reserved.


