Measuring the Effects of Uncertainty on the Diesel Market
- Days of supply shows a tight U.S. diesel inventory situation
- Price action has not been reflecting supply & demand fundamentals
- Policy uncertainty has curtailed the activity of commercial diesel buyers
- U.S. LNG now plays a critical role as a global balancer
Sincerely,
David Thompson, CMT
Executive Vice President
Powerhouse
(202) 333-5380
The Matrix
The chart immediately below shows the days of supply of U.S. distillate fuel. This is the number of barrels in inventory divided by current demand. A quick glance reveals the days of supply has dropped noticeably since the beginning of January indicating a tighter supply picture. The current days of supply is 28.7 days versus a year-ago level of 32.0 and a 5-year average of 31.8 days.
With all other things being equal, it would be reasonable to expect the typical, seasonal Spring rally in refined products prices to be in full force. The rally is driven in large part by this exact dynamic – the onset of refinery maintenance leading to a reduction in wholesale supply.

The next chart displays the rolling, front-month NYMEX ULSD contract and the open-interest level of all ULSD futures contracts. Price started rallying in early December, a very typical time frame for the beginning of the seasonal price move. The sell-off that started in January may well be linked to OPEC+’s decision to bring previously sidelined crude oil production back online.
However, the open interest statistic for ULSD futures adds important color to the conversation. From the recent peak in diesel prices on January 21st to March 18th, open interest dropped 10.6% as price dropped over 45 cents per gallon. Falling open interest paired with falling price indicates that holders of existing long positions are motivated sellers. Speculators comprise a smaller percentage market share. Most holder of long diesel futures positions are those who need to buy diesel fuel – end users or the marketers who supply them.

Source: LSEG
While it’s not possible to know with certainty the things that move a market, the stratospheric rise in uncertainty over US economic policies seems a highly likely possibility. A tariff-induced reduction in global economic activity will reduce the demand for the fuel of global growth (diesel).

Countless market commentators have opined about whether or not the tariffs will be long-lasting or if they will even go into full effect. Rather than gaze into a crystal ball, POWERHOUSE suggests watching open interest statistics. At present, commercial diesel buyers are on the sidelines. A price move that occurs in combination with rising open interest may tell us that some form of certainty is returning to the market.
Supply/Demand Balances
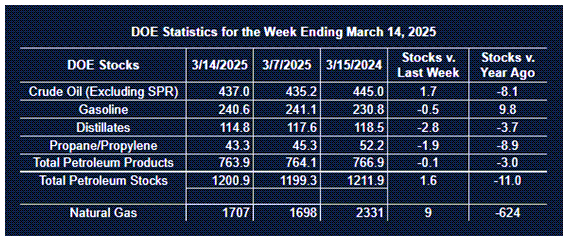
Supply/demand data in the United States for the week ended March 14, 2025, were released by the Energy Information Administration.
Total commercial stocks of petroleum increased (⬆) 1.6 million barrels to 1.2009 billion barrels during the week ended March 14th, 2025.
Commercial crude oil supplies in the United States were higher (⬆) by 1.7 million barrels from the previous report week to 437.0 million barrels.
Crude oil inventory changes by PAD District:
PADD 1: Down (⬇) 0.2 million barrels to 8.4 million barrels
PADD 2: Down (⬇) 2.3 million barrels to 105.5 million barrels
PADD 3: Up (⬆) 3.5 million barrels to 252.3 million barrels
PADD 4: Up (⬆) 0.3 million barrels to 24.7 million barrels
PADD 5: Up (⬆) 0.4 million barrels to 46.0 million barrels
Cushing, Oklahoma, inventories were down (⬇) 1.0 million barrels to 23.5 million barrels.
Domestic crude oil production decreased (⬇) 2,000 barrels per day from the previous report at 13.573 million barrels per day.
Crude oil imports averaged 5.385 million barrels per day, a daily decrease (⬇) of 85,000 barrels. Exports increased (⬆) 1,354,000 barrels daily to 4.644 million barrels per day.
Refineries used 86.9% of capacity; an increase (⬆) of 0.4% from the previous report week.
Crude oil inputs to refineries decreased (⬇) 45,000 barrels daily; there were 15.663 million barrels per day of crude oil run to facilities. Gross inputs, which include blending stocks, increased (⬆) 69,000 barrels daily to 15.949 million barrels daily.
Total petroleum product inventories decreased (⬇) by 0.1 million barrels from the previous report week, up to 764.0 million barrels.
Total product demand decreased (⬇) 2,183,000 barrels daily to 19.417 million barrels per day.
Gasoline stocks decreased (⬇) 0.5 million barrels from the previous report week; total stocks are 240.6 million barrels.
Demand for gasoline decreased (⬇) 365,000 barrels per day to 8.817 million barrels per day.
Distillate fuel oil stocks decreased (⬇) 2.8 million barrels from the previous report week; distillate stocks are at 114.8 million barrels. EIA reported national distillate demand at 4.010 million barrels per day during the report week, an increase (⬆) of 113,000 barrels daily.
Propane stocks fell (⬇) 1.9 million barrels from the previous report to 43.3 million barrels. The report estimated current demand at 931,000 barrels per day, a decrease (⬇) of 678,000 barrels daily from the previous report week.
Natural Gas
The rise of U.S. LNG exports has changed the global gas market in fascinating ways. One nuance of U.S. LNG supply contracts is having profound effects on natural gas prices around the world.
Most U.S. LNG cargoes are sold without any restrictions on their final destination. This means the original buyer is permitted to resell the cargo. This contract feature is not offered by other major LNG exporters such as Qatar and Australia.
The flexibility this has introduced into the global market is astounding. After a colder-than-expected winter and increased industrial activity, European gas in storage stood at 33.9% of capacity far below year ago levels. When the last major pipeline delivering Russian gas to
Europe closed, market prices in Europe spiked. Market forces worked and high price attracted supply, but from an unlikely source.
While Europe was freezing over the winter, northern China was not. With their own demand down, Chinese buyers exercised the flexibility allowed under their U.S. contacts and resold several cargoes into the European market. In fact, Chinese LNG imports are expected to have dropped by 22% over Q1 of 2025.
In the immediate aftermath of the expiration of the deal that allowed for transit of Russian gas through Ukraine, tanker monitoring services tracked the following mid-Atlantic U-turns.

U.S. engineers may have kick started the shale revolution with fracking, but U.S. contract negotiators have delivered the flexibility to effectively arbitrage major price dislocations.
According to the EIA:
- Net injections into storage totaled 9 Bcf for the week ended March 14, compared with the five-year (2020–24) average net withdrawals of 31 Bcf and last year’s net injections of 5 Bcf during the same week. Working natural gas stocks totaled 1,707 Bcf, which is 190 Bcf (10%) lower than the five-year average and 624 Bcf (27%) lower than last year at this time.
- According to The Desk survey of natural gas analysts, estimates of the weekly net change to working natural gas stocks ranged from net withdrawals of 24 Bcf to net injections of 12 Bcf, with a median estimate of net injections of 1 Bcf.
- The average rate of withdrawals from storage is 22% higher than the five-year average so far in the withdrawal season (November through March). If the rate of withdrawals from storage matched the five-year average of 2.2 Bcf/d for the remainder of the withdrawal season, the total inventory would be 1,670 Bcf on March 31, which is 190 Bcf lower than the five-year average of 1,860 Bcf for that time of year.
Was this helpful? We’d like your feedback.
Please respond to [email protected]
This material has been prepared by a sales or trading employee or agent of Powerhouse Brokers, LLC and is, or is in the nature of, a solicitation. This material is not a research report prepared by Powerhouse Brokers, LLC. By accepting this communication, you agree that you are an experienced user of the futures markets, capable of making independent trading decisions, and agree that you are not, and will not, rely solely on this communication in making trading decisions.
DISTRIBUTION IN SOME JURISDICTIONS MAY BE PROHIBITED OR RESTRICTED BY LAW. PERSONS IN POSSESSION OF THIS COMMUNICATION INDIRECTLY SHOULD INFORM THEMSELVES ABOUT AND OBSERVE ANY SUCH PROHIBITION OR RESTRICTIONS. TO THE EXTENT THAT YOU HAVE RECEIVED THIS COMMUNICATION INDIRECTLY AND SOLICITATIONS ARE PROHIBITED IN YOUR JURISDICTION WITHOUT REGISTRATION, THE MARKET COMMENTARY IN THIS COMMUNICATION SHOULD NOT BE CONSIDERED A SOLICITATION.
The risk of loss in trading futures and/or options is substantial and each investor and/or trader must consider whether this is a suitable investment. Past performance, whether actual or indicated by simulated historical tests of strategies, is not indicative of future results. Trading advice is based on information taken from trades and statistical services and other sources that Powerhouse Brokers, LLC believes are reliable. We do not guarantee that such information is accurate or complete and it should not be relied upon as such. Trading advice reflects our good faith judgment at a specific time and is subject to change without notice. There is no guarantee that the advice we give will result in profitable trades.
Copyright 2025 Powerhouse Brokers, LLC, All rights reserved