Crude Oil Stocks to Grow
- Crude oil faces growing surplus
- Crude oil price gap develops
- Oil product prices not so weak as crude oil
- Heating Degree Days lag normal by 12%

The Matrix
WTI crude oil futures lost about 70 percent of their value over the past eleven weeks. Uncertainty proliferated. The ongoing covid-19 pandemic and conflict in the OPEC+ group pushed prices lower.
Prices for ULSD and WTI crude oil are tracing out price essentially unchanged over the past several days. Powerhouse puts new support levels for crude oil around $16.70 (from January 2001) and then $9.75, the all-time futures low established in April 1986.
WTI spot futures topped at $65.65 early in January. Prices fell to $19.46 last week.
The price drop left a gap between $41.05 and $36.35. Traders now have an objective when prices recover. (Filling this gap requires a rally of nearly half of the total WTI crude oil price drop this year.)
ULSD prices were under pressure, but not nearly as much as WTI. Futures lost $1.1850 thus far this year, about half its value. The ability of ULSD to soften downward price pressure reflects its position in commercial activity.
ULSD support is found at $0.8487 (from January 2016) and $0.6690 (set in May, 2003.) ULSD prices have held up far better than RBOB prices. We are well above ultimate support in ULSD.
Gasoline is a retail commodity. Its value has been undercut by many projections of lowering consumer demand. The April RBOB futures contract settled on Friday, March 20, 2020 at $0.6054, reportedly the lowest futures price in 19 years. Prices moved even lower on Monday, losing nearly sixteen more cents in the spot April contract.
RBOB has lost about $1.35 in value this year. The loss created a negative gasoline crack spread in the May contract.
Major support for gasoline futures lies below at $0.3160, last seen in November 1998. If that fails, the all-time low can be seen at $0.3025. This level may seem unlikely but, in our experience, commodity prices are very reactive. Plan on high volatility for several months going forward.
Forecasts of the loss of global crude oil demand have been running as high as ten million barrels per day. Expectations of crude oil production, on the other hand, have been boosted, reflecting a rupture among OPEC+ participants. Saudi Arabia has offered crude oil at steep discounts in support of its effort to maintain market share.
The United States has said it would send a representative to Saudi Arabia to represent our interests in the “fallout of a Saudi-Russia oil price war.” There has even been talk of Texas imposing limits on production, an action not seen since the early 1970s.
Supply/Demand Balances
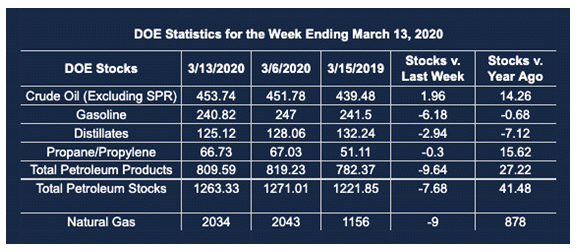
Supply/demand data in the United States for the week ending March 13, 2020, were released by the Energy Information Administration.
Total commercial stocks of petroleum fell by 7.7 million barrels during the week ending March 13, 2020.
Commercial crude oil supplies in the United States increased by 2.0 million barrels from the previous report week to 453.7 million barrels.
Crude oil inventory changes by PAD District:
PADD 1: Down 0.1 million barrels to 11.1 million barrels
PADD 2: Plus 0.7 million barrels to 127.4 million barrels
PADD 3: Plus 1.7 million barrels to 243.9 million barrels
PADD 4: Plus 0.1 from the previous report week at 20.6 million barrels
PADD 5: Down 0.5 million barrels to 50.7 million barrels
Cushing, Oklahoma inventories were up 0.5 million barrels from the previous report week to 38.4 million barrels.
Domestic crude oil production rose 100,000 barrels per day from the previous report week to 13.1 million barrels daily.
Crude oil imports averaged 6.539 million barrels per day, a daily increase of 127,000 barrels. Exports rose 968,000 barrels daily to 4.378 million barrels per day.
Refineries used 86.4 percent of capacity, unchanged from the previous report week.
Crude oil inputs to refineries increased 118,000 barrels daily; there were 15.820 million barrels per day of crude oil run to facilities. Gross inputs, which include blending stocks, fell 5,000 barrels daily to reach 16.243 million barrels daily.
Total petroleum product inventories fell 9.7 million barrels from the previous report week.
Gasoline stocks decreased 6.2 million barrels daily from the previous report week; total stocks are 240.8 million barrels.
Demand for gasoline rose 247,000 barrels per day to 9.696 million barrels per day.
Total product demand decreased 383,000 barrels daily to 21.477 million barrels per day.
Distillate fuel oil stocks decreased 2.9 million barrels from the previous report week; distillate stocks are at 125.1 million barrels. EIA reported national distillate demand at 4.013 million barrels per day during the report week, an decrease of 385,000 barrels daily.
Propane stocks decreased 0.3 million barrels from the previous report week; propane stocks are 66.7 million barrels. The report estimated current demand at 1.079 million barrels per day, a decrease of 382,000 barrels daily from the previous report week.
Natural Gas
Prices for natural gas futures challenged technical support last week as lowering Heating Degree Days cut demand. HDDs in the United States trail long-term averages by 12 per cent and against last year by 9 percent.
Support has been pegged at $1.60 or so.
According to EIA:
The net withdrawal from [natural gas] storage totaled 9 Bcf for the week ending March 13, compared with the five-year (2015–19) average net withdrawal of 63 Bcf and last year’s net withdrawal of 91 Bcf during the same week. Working natural gas stocks totaled 2,034 Bcf, which is 281 Bcf more than the five-year average and 878 Bcf more than last year at this time.
The average rate of withdrawal from storage is 13% lower than the five-year average so far in the withdrawal season (November through March). If the rate of withdrawal from storage matched the five-year average of 3.1 Bcf/d for the remainder of the withdrawal season, the total inventory would be 1,978 Bcf on March 31, which is 281 Bcf higher than the five-year average of 1,697 Bcf for that time of year.
Futures trading involves significant risk and is not suitable for everyone. Transactions in securities futures, commodity and index futures and options on future markets carry a high degree of risk. The amount of initial margin is small relative to the value of the futures contract, meaning that transactions are heavily “leveraged”. A relatively small market movement will have a proportionately larger impact on the funds you have deposited or will have to deposit: this may work against you as well as for you. You may sustain a total loss of initial margin funds and any additional funds deposited with the clearing firm to maintain your position. If the market moves against your position or margin levels are increased, you may be called upon to pay substantial additional funds on short notice to maintain your position. If you fail to comply with a request for additional funds within the time prescribed, your position may be liquidated at a loss and you will be liable for any resulting deficit. Past performance may not be indicative of future results. This is not an offer to invest in any investment program.
Powerhouse is a registered affiliate of Coquest, Inc.
Was this helpful? We’d like your feedback.
Please respond to [email protected]
Copyright© 2020 Powerhouse, All rights reserved.