

Energy Futures Prices Shaken by Banking Turmoil
- Futures fall due to banking crisis
- Crude oil inventory rose
- EIA: steady oil demand through 2040
- Ukraine war shows new international posture of natural gas
Sincerely,
Alan Levine, Chairman
Powerhouse
(202) 333-5380
The Matrix
Spot energy futures prices reacted negatively to an unanticipated banking crisis, moving lower for the week ended March 17, 2023. The problems in the finance sector appear to have been contained by decisive governmental action. Ironically, some analysts point to that same government for single-minded actions raising interest rates to contain inflation as creating the conditions for these bank failures.
The turmoil has reignited fears of a recession. One investment house has raised its estimate of a recession this year to 35% from 25%. This week, the Federal Reserve will need, once again, to balance the cost of inflation against a possibility of a business turndown. Hobson’s choice was easier.
Crude oil futures prices were hit hardest during the week. Spot futures fell $10.73, settling at $66.74. This level had not been visited since December 2021. The weekly change continued a downdraft that has seen WTI futures fall 17.5% in March.
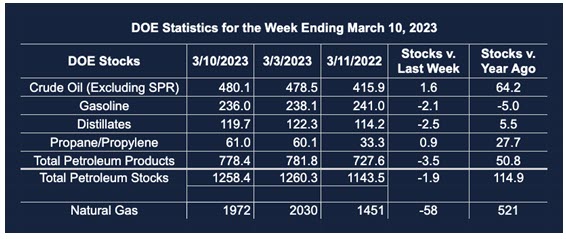
Inventory data for the week ended March 10, 2023, showed a bearish increase in crude oil stocks of 1.6 million barrels. This was more than offset by declines in products, in all, 3.5 million barrels. Gasoline stocks fell 2.1 million barrels and distillates dropped 2.5 million barrels. The net decline in liquids supply was not enough, however, to provide a bullish lift to prices.
Refinery utilization rose 2.2 percentage points for the report week, to 88.2%. Notably, facilities in the Midwest are operating even more intensely, at 92.4% of capacity.
The EIA’s annual report for 2023 offered an optimistic perspective for the oil industry through 2040. The agency projected steady U.S. petroleum demand and “historically high” crude oil production over the period. The expansion of renewables was expected to accelerate in any case.
Supply/Demand Balances
Supply/demand data in the United States for the week ended March 10, 2023, were released by the Energy Information Administration.
Total commercial stocks of petroleum fell (⬇) 1.9 million barrels to 1.258 billion barrels during the week ended March 10, 2023.
Commercial crude oil supplies in the United States were higher (⬆) by 1.6 million barrels from the previous report week to 480.1 million barrels.
Crude oil inventory changes by PAD District:
PADD 1: Down (⬇) 0.1 million barrels to 6.6 million barrels
PADD 2: Down (⬇) 3.3 million barrels to 125.0 million barrels
PADD 3: Plus (⬆) 2.7 million barrels to 272.6 million barrels
PADD 4: Plus (⬆) 0.3 million barrels to 25.0 million barrels
PADD 5: Plus (⬆) 1.9 million barrels to 50.9 million barrels
Cushing, Oklahoma, inventories were up down (⬇) 1.9 million barrels from the previous report week to 37.9 million barrels.
Domestic crude oil production was unchanged (=) from the previous report week at 12.2 million barrels daily.
Crude oil imports averaged 6.216 million barrels per day, a daily decrease (⬇) of 55,000 barrels. Exports increased (⬆) 1.665 million barrels daily to 5.027 million barrels per day.
Refineries used 88.2% of capacity; 2.2 percentage points higher (⬆) than the previous report week.
Crude oil inputs to refineries increased (⬆) 430,000 barrels daily; there were 15.398 million barrels per day of crude oil run to facilities. Gross inputs, which include blending stocks, rose (⬆) 405,000 barrels daily to 15.885 million barrels daily.
Total petroleum product inventories fell (⬇) by 3.5 million barrels from the previous report week, falling to 778.3 million barrels.
Total product demand increased (⬆) 64,000 barrels daily to 19.113 million barrels per day.
Gasoline stocks decreased (⬇) 2.1 million barrels from the previous report week; total stocks are 236.0 million barrels.
Demand for gasoline increased (⬆) 32,000 barrels per day to 8.594 million barrels per day.
Distillate fuel oil stocks decreased (⬇) 2.5 million barrels from the previous report week; distillate stocks are at 119.7 million barrels. EIA reported national distillate demand at 3.736 million barrels per day during the report week, an increase (⬆) of 222,000 barrels daily.
Propane stocks increased (⬆) by 0.9 million barrels from the previous report week to 61.0 million barrels. The report estimated current demand at 713,000 barrels per day, a decrease (⬇) of 520,000 barrels daily from the previous report week.
Natural Gas
The Ukraine war that began last year significantly disrupted distribution patterns of natural gas. It also demonstrated the shift from natural gas as a resource largely for domestic purposes to one of international significance. Reliance on Russia for the bulk of natural gas used in the European Union changed abruptly.
The change came at a time when the United States was developing significant Liquified Natural Gas (LNG) export facilities along the Gulf Coast, allowing the U.S. to become a major supplier to western Europe. The Energy Information Administration has released data on LNG exports over the past three years. They show how dramatically this has changed global flows of natural gas.
LNG is the swing factor when considering natural gas use regions. The chart below shows how Europe has taken volume and share from other overseas destinations.
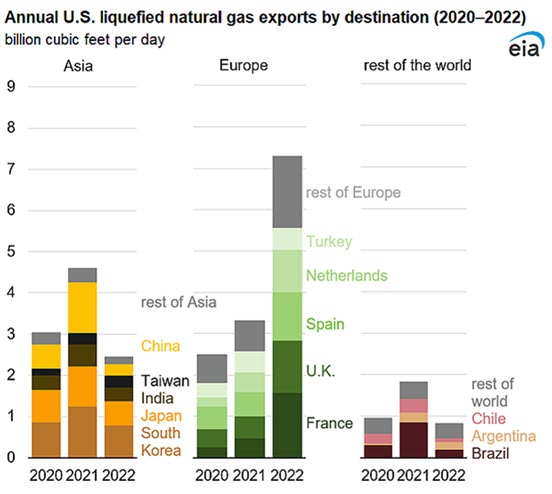
The United States exported 10.6 Bcf of LNG last year. Europe took 6.8 Bcf of American LNG exports, nearly two-thirds of total outflows. Most of that went to France, the U.K., Spain, and the Netherlands. Exports to Europe increased 4.0 Bcf during 2022, a whopping 141% over 2021.
The shift to Europe came at the expense of Asia, a traditional destination for American LNG. The largest drop came with China, where imports fell by 78%, year over year. (China was able to offset some of the loss by using pipelines, where such imports increased by 8% over 2021. Latin America lost 1.1 Bcf/d of U.S. LNG versus 2021. This was felt largely in Brazil where hydropower recovered some its share of power generation.
According to the EIA:
Net [natural gas} withdrawals from storage totaled 58 Bcf for the week ended March 10, compared with the five-year (2018–2022) average net withdrawals of 77 Bcf and last year’s net withdrawals of 86 Bcf during the same week. Working natural gas stocks totaled 1,972 Bcf, which is 378 Bcf (24%) more than the five-year average and 521 Bcf (36%) more than last year at this time.
The average rate of withdrawals from storage is 24% lower than the five-year average so far in the withdrawal season (November through March). If the rate of withdrawals from storage matched the five-year average of 3.0 Bcf/d for the remainder of the withdrawal season, the total inventory would be 1,910 Bcf on March 31, which is 378 Bcf higher than the five-year average of 1,532 Bcf for that time of year.
Was this helpful? We’d like your feedback.
Please respond to [email protected]
Powerhouse Futures & Trading Disclaimer
Copyright 2023 Powerhouse Brokerage, LLC, All rights reserved

