WTI Crude Oil Yields New High
- U.S. is new nexus of oil geopolitics
- U.S. is 70 per cent of global supply growth
- U.S. refineries coming out of turnaround
- Natural gas supply supported by growing crude oil production

The Matrix
Weeks of indecision trapped oil prices. Spot WTI crude oil futures had been range bound since February 11th when values fell to $51.23. They traded since then up to $59.00. A report of U.S. crude oil inventory for the week ending March 8 showed a decline of nearly four million barrels to 449 million barrels. This continued a generally downward trend of crude oil supply since March, 2017 when inventory topped at 534 million barrels. Crude oil prices responded on March 13, moving to a new high of $58.48, a price seen last in November, 2018.
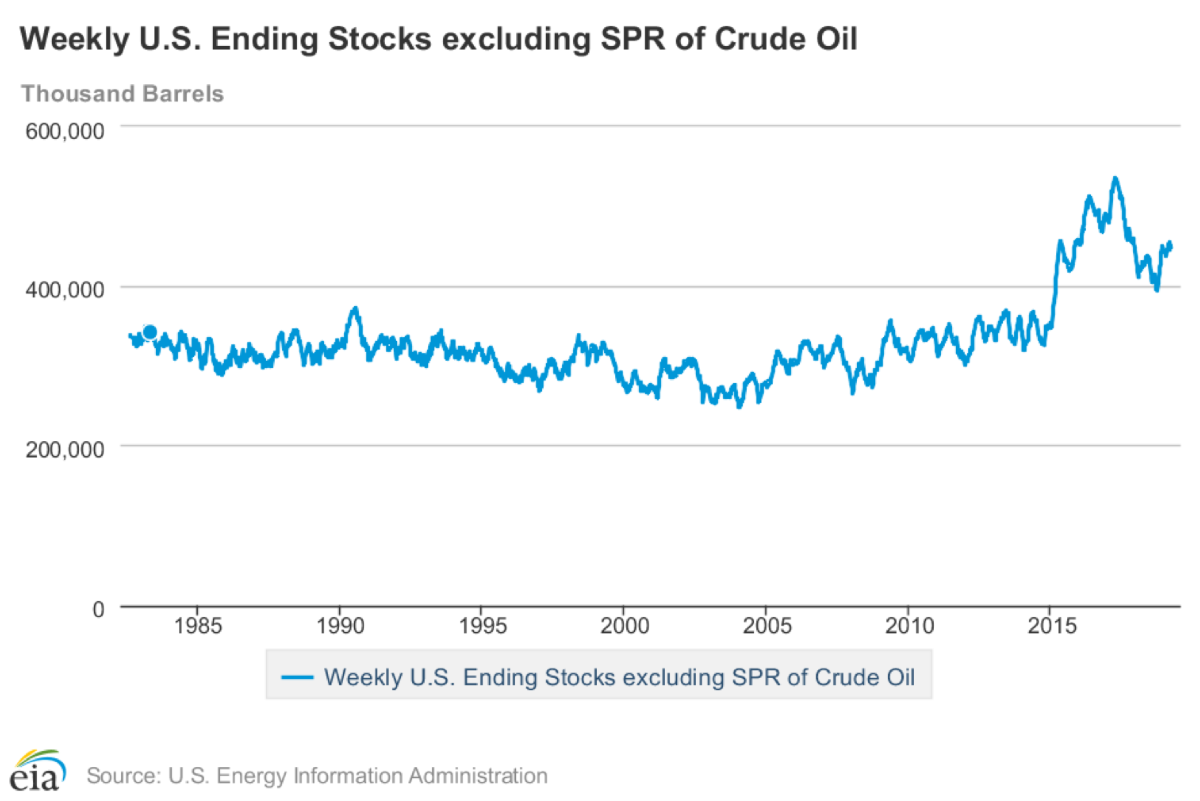
Weekly Crude Stocks 1983 – 2019
Source: EIA
The geography of petroleum has been shifting towards the United States. The country is becoming a center of global activity, reflecting growth in crude oil production and exports. The International Energy Agency anticipates the U.S. will contribute about 70 per cent of global growth in oil output and three-quarters of global gains in LNG exports over the next five years. IEA also says the United States led global demand growth, moving past a slowing China. And the Agency expects demand to keep growing, reflecting gains in petrochemicals, jet fuel and maritime fuels.
In the near-term, crude oil supply should be coming under pressure, a bullish price sign. Refineries will be coming out of turnaround in April and May. Crude oil inputs to refining added 30,000 barrels per day, reflecting a small increase to 87.6 per cent in refinery use. OPEC+ cuts are starting to work and Saudi Arabia has reportedly proposed extending the cuts until year-end. Moreover, Venezuela is facing problems in exporting crude oil as is Iran.
Price strength appears to be the principal driving force for 2019. Demand growth has been supported by arguably undervalued crude oil. Crude oil price forecasts range as high as $62 in 2019 and $93 in 2020. In addition to the bullish factors mentioned here, is implementation of the International Maritime Organization (IMO) 2020 low-sulfur fuel regulations. IMO 202 could add 1.5 million barrels dally to 2019 demand.
Supply/Demand Balances
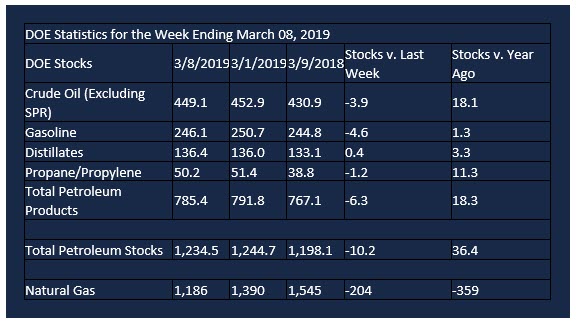
Supply/demand data in the United States for the week ending March 8, 2019 were released by the Energy Information Administration.
Total commercial stocks of petroleum decreased 10.2 million barrels during the week ending March 8, 2019.
There were draws in stocks of gasoline, fuel ethanol, K-Jet fuel, residual fuels, and propane. There were builds in stocks of distillates and other oils.
Commercial crude oil supplies in the United States decreased 3.9 million barrels from the previous report week to 449.1 million barrels.
Crude oil supplies decreased in two of the five PAD Districts. PADD 3 (Gulf Coast) crude oil stocks fell 5.4 million barrels, PADD 5 (West Coast) crude stocks decreased 3.1 million barrels. PADD 1 (East Coast) stocks advanced 3.1 million barrels, PADD 2 (Midwest) stocks rose 1.4 million barrels, and PAD 4 (Rockies)s stocks increased 0.1 million barrels.
Cushing, Oklahoma inventories decreased 0.6 million barrels from the previous report week to 46.9 million barrels.
Domestic crude oil production fell 100,000 barrels daily from the previous report week to 12.0 million barrels per day.
Crude oil imports averaged 6.746 million barrels per day, a daily decrease of 255,000 barrels per day. Exports declined 257,000 barrels daily to 2.546 million barrels per day.
Refineries used 87.6 per cent of capacity, an increase of 0.1 percentage points from the previous report week.
Crude oil inputs to refineries increased 30,000 barrels daily; there were 16.020 million barrels per day of crude oil run to facilities.
Gross inputs, which include blending stocks, rose 5,000 barrels daily to 16.290 million barrels daily.
Total petroleum product inventories fell 6.3 million barrels from the previous report week.
Gasoline stocks decreased 4.6 million barrels from the previous report week; total stocks are 246.1 million barrels.
Demand for gasoline increased 78,000 barrels per day to 9.140 million barrels per day.
Total product demand increased 318,000 barrels daily to 20.808 million barrels per day.
Distillate fuel oil stocks increased 0.4 barrels from the previous report week; distillate stocks are at 136.4 million barrels. National distillate demand was reported at 3.953 million barrels per day during the report week. This was a weekly decrease of 192,000 barrels daily.
Propane stocks decreased 1.2 million barrels from the previous report week; propane stock are 50.2 million barrels. Current demand is estimated at 1.299 million barrels per day, a decrease of 327,000 barrels daily from the previous report week.
Natural Gas
According to the Energy Information Administration:
Net withdrawals from storage totaled 204 Bcf for the week ending March 8, compared with the five-year (2014–18) average net withdrawals of 99 Bcf and last year’s net withdrawals of 88 Bcf during the same week. Working gas stocks totaled 1,186 Bcf, which is 569 Bcf lower than the five-year average and 359 Bcf lower than last year at this time.
The average rate of net withdrawals from storage is 3% lower than the five-year average so far in the withdrawal season (November through March). If the rate of withdrawals from storage matched the five-year average of 5.2 Bcf/d for the remainder of the withdrawal season, total inventories would be 1,067 Bcf on March 31, which is 569 Bcf lower than the five-year average of 1,636 Bcf for that time of year.
The price outlook for natural gas is constrained by its inverted relationship with oil. Higher oil prices lead to more production and perforce, more associated natural gas.
Futures trading involves significant risk and is not suitable for everyone. Transactions in securities futures, commodity and index futures and options on future markets carry a high degree of risk. The amount of initial margin is small relative to the value of the futures contract, meaning that transactions are heavily “leveraged”. A relatively small market movement will have a proportionately larger impact on the funds you have deposited or will have to deposit: this may work against you as well as for you. You may sustain a total loss of initial margin funds and any additional funds deposited with the clearing firm to maintain your position. If the market moves against your position or margin levels are increased, you may be called upon to pay substantial additional funds on short notice to maintain your position. If you fail to comply with a request for additional funds within the time prescribed, your position may be liquidated at a loss and you will be liable for any resulting deficit. Past performance may not be indicative of future results. This is not an offer to invest in any investment program.
Powerhouse is a registered affiliate of Coquest, Inc.
Was this helpful? We’d like your feedback.
Please respond to [email protected]
Copyright© 2019 Powerhouse, All rights reserved.